The single instance view includes an Overview and Sessions sections for the selected monitored SQL server.

Some other options you can find in the single instance view are
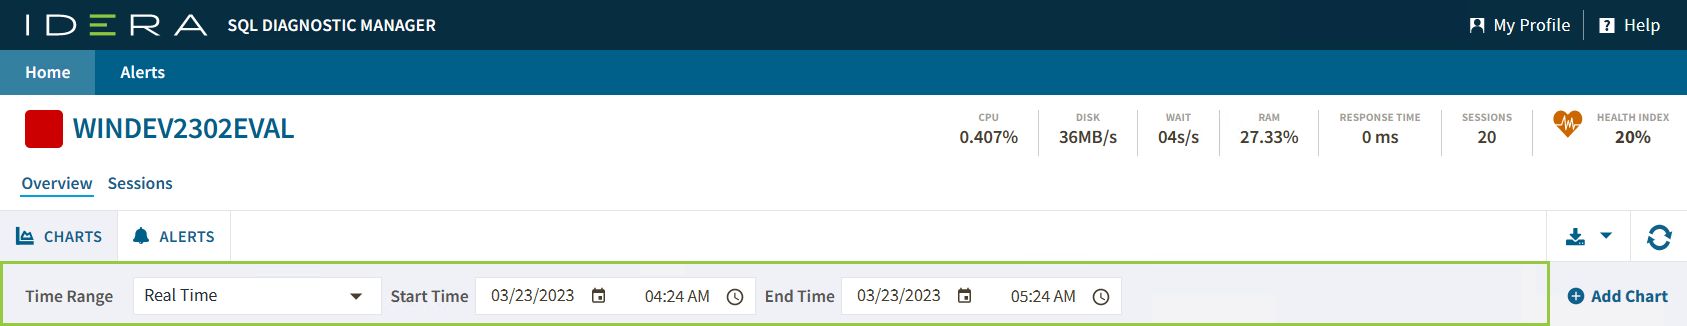
Time Range Filter
IDERA Web Console also includes a Time Range Filter, located at the top of the Web Console. You can modify it by changing the start and end time and date.
Dashboard Header
The Dashboard Header summarizes the SQL Server instance performance.

In this section, you can find the server summary that show the metrics of the selected instance, such as:
Server Name
Displays the server name of your instance.
CPU
Refers to the average percentage of SQL Server processor usage on the computer hosting the SQL Server instance.
Disk
Refers to the number of physical reads and physical writes made by the SQL Server instance between refreshes.
Wait
Displays the Total Server Waits for the monitored SQL Server instance.
RAM
Displays the percentage of allocated memory to SQL Server instance in usage.
Response Time
Displays the calculated time that SQL Diagnostic Manager needs to send a simple SQL command to the instance, have it processed, and receive the returned result set.
Sessions
Displays the current number of sessions in an SQL Server instance.
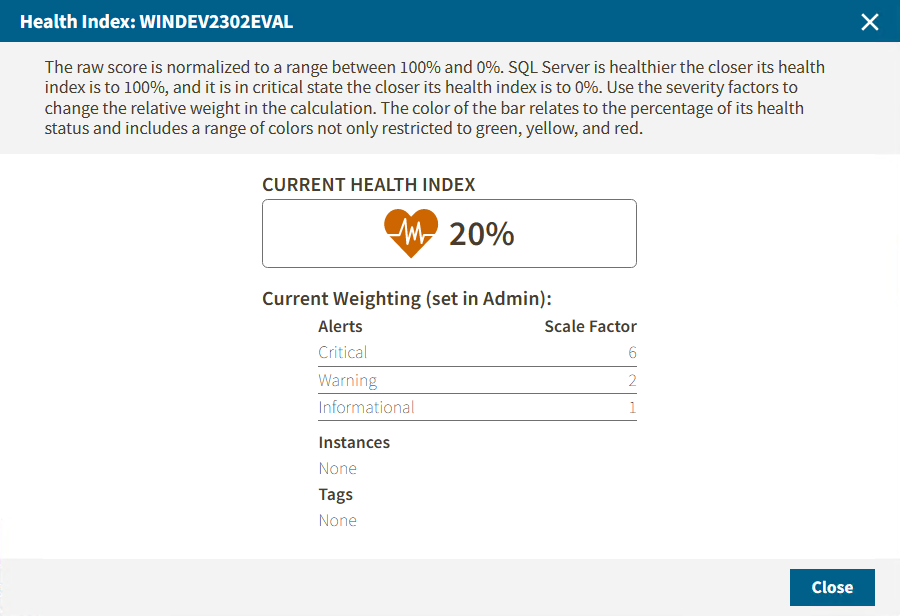
Health Index
Shows the current instance health in percentage. To have a wider view of this option click on the metric and the following window will pop up.