The SQLDM Web Console is a development that allows users to get an overview of the status of small and large SQL Diagnostic Manager deployments, which you can use on your computer or mobile device. To start navigating the SQLDM Web Console, you must previously install and log in to SQLDM Web Console.
The SQLDM Web Console interface boasts an easy-to-navigate dashboard comprised of different views and tabs that provide a complete synopsis of your SQL Diagnostic Manager environment.
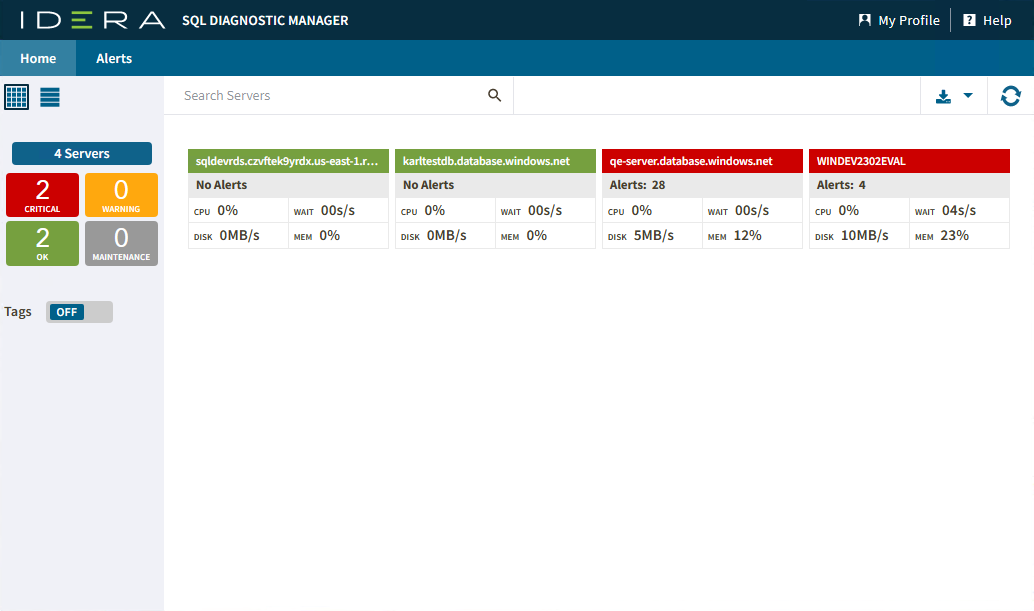
When navigating the SQLDM Web Console you can find the following options to manage your SQL Server monitored instances.
Main tabs
SQLDM Web Console presents two main tabs that will allow you to track your SQL Server instances:
- Home tab - Gives you an overview of your SQL Server monitored instances.
- Alerts tab - Summarizes the warning and critical alerts of your SQL Server instances.
Profile and Help settings
SQLDM Web Console allows you to perform some other actions such as personalizing the interface with the My Profile option and finding SQL Diagnostic Documentation support with the Help option.
My Profile
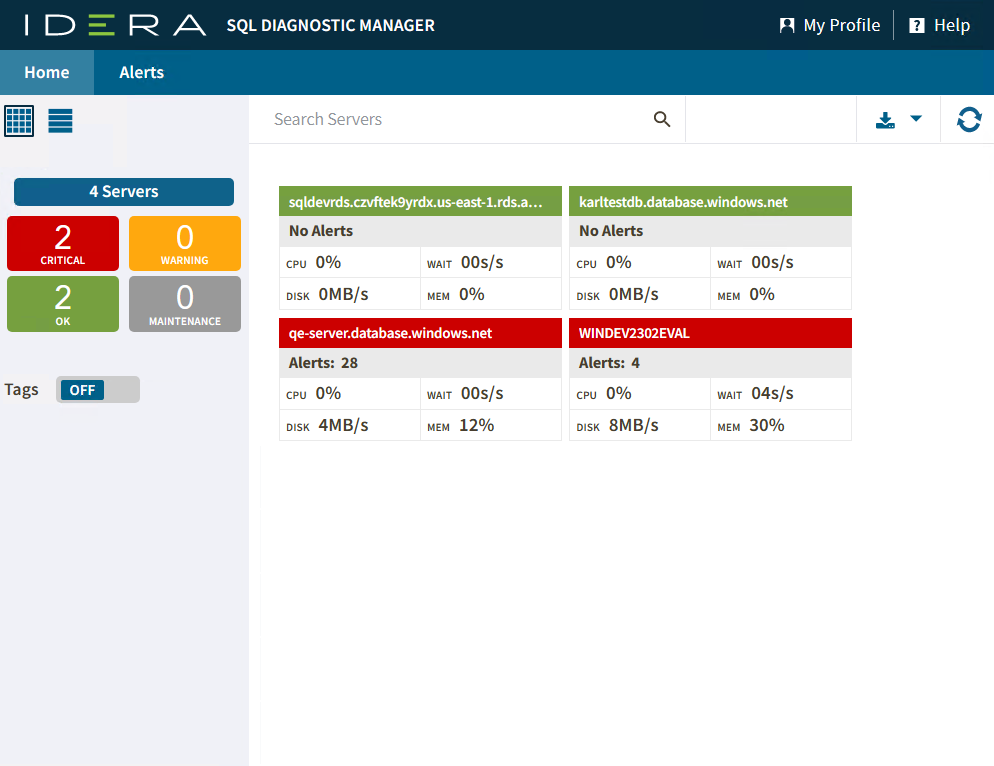
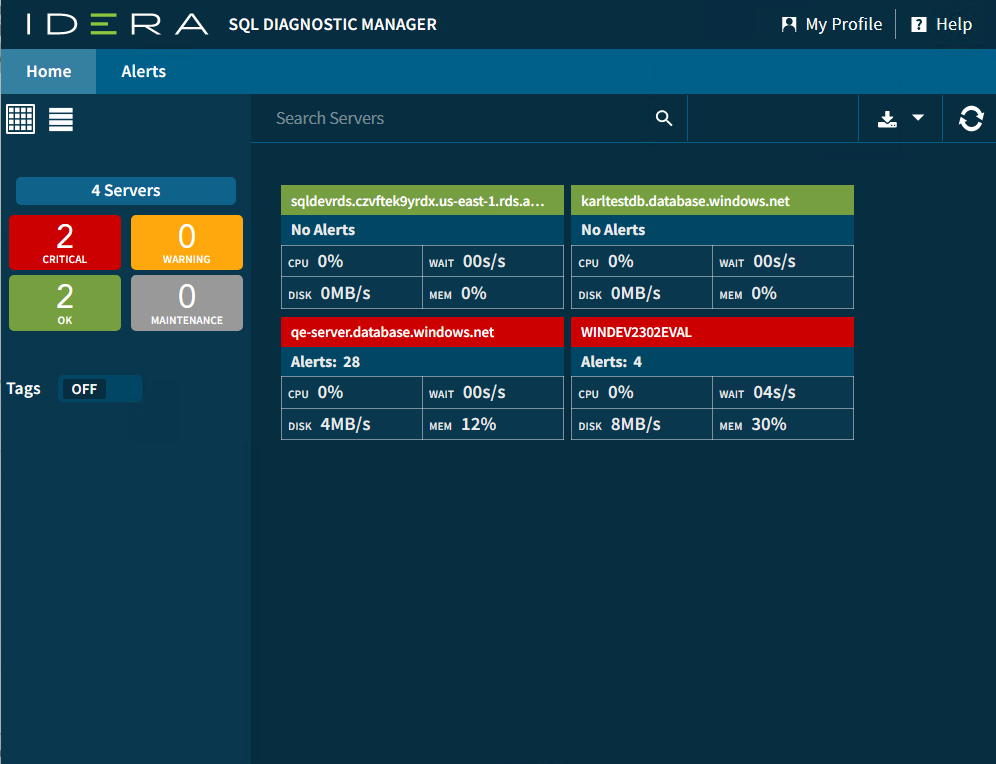
Allows you to personalize the interface appearance. Click on My Profile and select between the following modes.
| Ligh Mode | Dark Mode |
|---|---|
|
|
Help
In case you have any doubts using the SQLDM Web Console or SQL Diagnostic Manager, you can have product help when clicking the Help option, it will redirect you to the documentation wiki.