The single instance view provides the Overview tab, which helps you to check your alerts in a graphic and detailed way with the following sections.
Charts
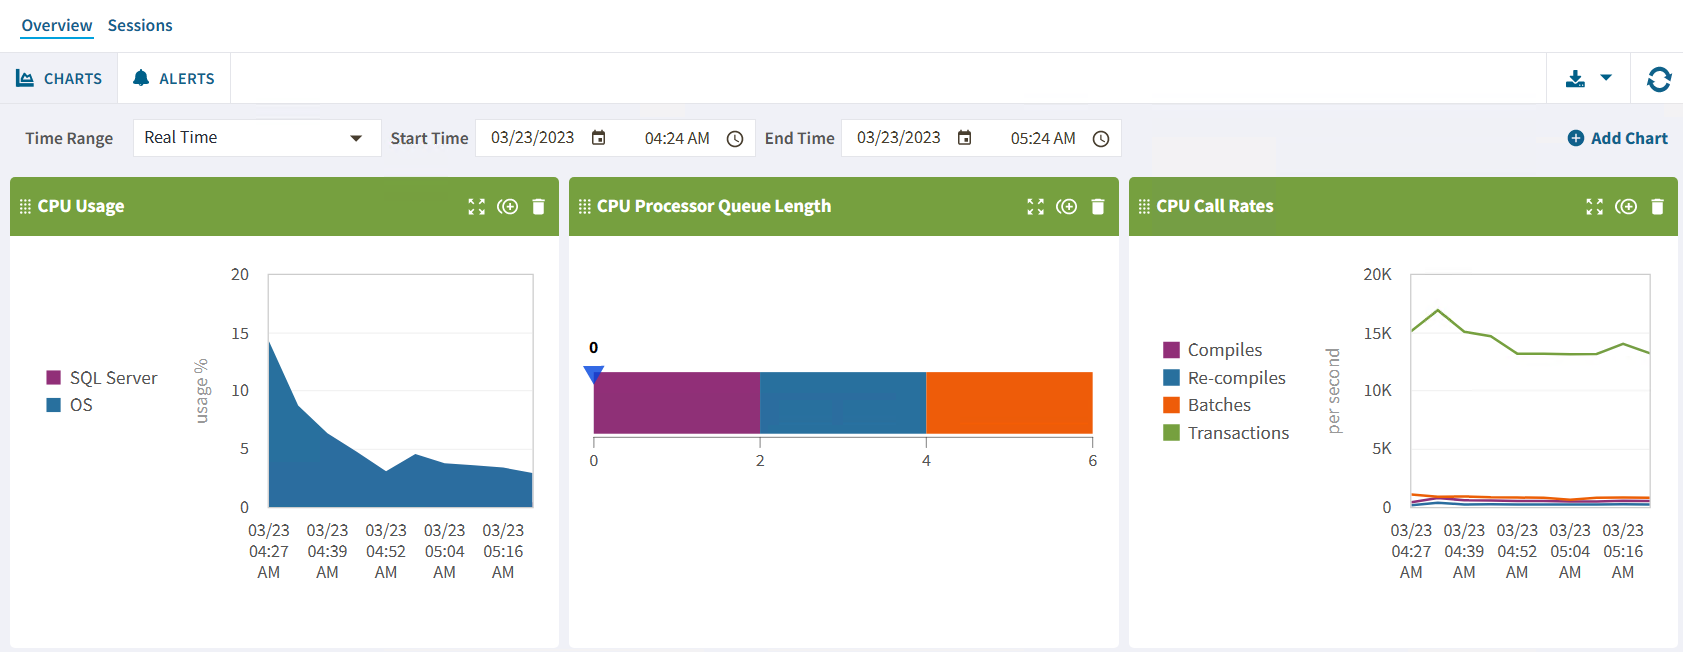
The Charts view provides you with complete graphic instance monitoring from the SQL Diagnostic Manager Server application. Each chart has the following capabilities:
- Drag and drop - To change the position of a chart, drag it by clicking the
 icon and moving the chart to the position you like.
 - Expand and contract - To get a wider view of the chart, click the
 icon.
icon. - Duplicate - To duplicate a chart click the
 icon.
icon. - Remove - To delete a chart from the overview view, click the
 icon.
icon.
You can find the options above in the header of each chart.
The single instance dashboard also includes the option Add Chart. Click it and the Manage Charts window will pop up, allowing you to choose the graphs to be displayed in the overview single instance view.
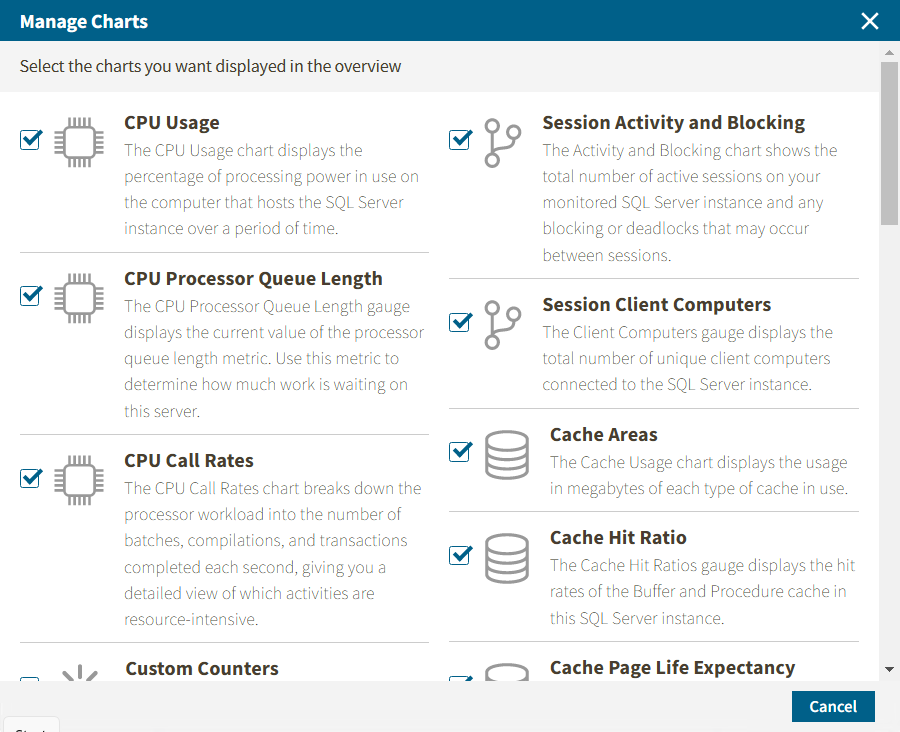
The Manage Charts window allows you to choose as many charts as you want from the following options:
CPU Usage
The CPU Usage chart displays the percentage of the processing power on the computer that hosts the SQL Server instance over a period of time.
CPU Processor Queue Lenght
The CPU Processor Queue Length graph displays the current value of the processor queue length metric. Use this metric to determine how much work is waiting on this server.
CPU Call Rates
The CPU Call Rates chart breaks down the processor workload into the number of batches, compilations, and transactions completed each second. Through this chart, you can get a detailed view of the resource-intensive activities.
Cache Areas
The Cache Usage chart displays the usage in megabytes of each type of cache in use on your instance.
Cache Hit Ratio
The Cache Hit Ratios gauge displays the hit rates of the Buffer and Procedure cache in the monitored SQL Server instance. Configure the Procedure Cache Hit Ratio (Percent) alert to warn you about any issue related.
Custom Counters
The Custom Counters panel displays the statistics of a selected custom counter on a monitored SQL Server instance.
Databases
The Databases panel tracks the performance of the databases on your monitored SQL Server.
Disk Latency
The Disk Latency chart plots the average time (in milliseconds) required to complete disk reads and writes, tracking the disk IO speed over time.
Cache Page Life Expectancy
The Page Life Expectancy chart provides the time in seconds that a page remains in the cache or buffer pool. The longer your page stays in the cache, the more likely the chance that SQL Server finds that data quickly without a read of physical media and minimizes processing resource use. Use the Page Life Expectancy alert to warn you of issues.
File Activity
The File Activity panel displays the top five database files with the highest relative activity since the last refresh.
Lock Waits
The Lock Waits panel tracks the total number waits caused when a task is waiting to acquire a lock on your monitored SQL Server.
Disk SQL Server Physical I/O
The SQL Server Physical I/O chart breaks down the SQL Server throughput into its key component pieces, giving you a detailed view of how well the SQL Server is processing your data requests and updates.
Disk Throughput
The Disk Throughput chart plots the number of disk reads and writes over time.
Memory SQL Server Usage
The SQL Server Usage chart compares the amount of memory allocated and used by SQL Server to the total memory consumed by a computer.
Memory Paging
The SQL Server Paging chart plots the number of swapped pages per second, over time, as calculated by the memory paging metric.
Memory Usage
The Memory Usage chart compares the amount of memory allocated and used by SQL Server to the total memory consumed by this virtual machine.
Network Response Time
The Response Time gauge displays the time (in milliseconds) SQL diagnostic manager currently needs to send a simple SQL command to the SQL Server instance, have it processed, and receive the returned result set.
Network Throughput
The Throughput chart plots how many packets this SQL Server sends and receives over time.
Server Waits
The Server Waits panel tracks the total number and time spent on waits affecting your monitored SQL Server.
Session Activity and Blocking
The Activity and Blocking chart displays the total number of active sessions on your monitored SQL Server instance and any blocking or deadlocks that may occur between sessions.
Session Client Computers
The Client Computers graph displays the total number of unique client computers connected to the SQL Server instance.
Tempdb Contention
The Tempdb Contention chart provides the latch wait time for the allocation pages of your tempdb.
Tempdb Space Used
The Tempdb Space Used chart provides different views of how your database is used over time based on the object type.
Tempdb Version Store Cleanup Rate
The Version Store Cleanup Rate gauge displays the current version store cleanup rate and the version generation rate of the data rows necessary to support snapshot isolation.
Virtualization CPU Ready Wait Time
The CPU Ready Wait Time gauge displays the current gauge value of the vCPU Ready Time metric available on the Server Details view.
Virtualization Disk Usage
The Virtual Disk Usage chart displays the amount of data read from and written to disk for the VM or host server during the sample interval.
Virtualization Memory Usage
The Virtual Memory Usage chart displays the amount of memory allocated and used by SQL Server to the total memory consumed on this VM or host server.
Alerts
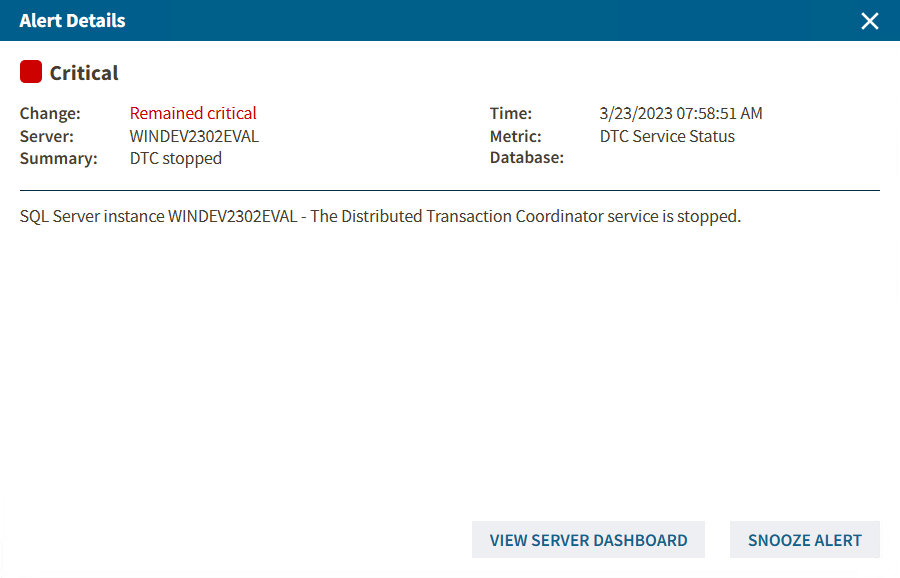
The single instance dashboard summarizes the critical and warning alerts of your instance in a detailed view, shown as follows.
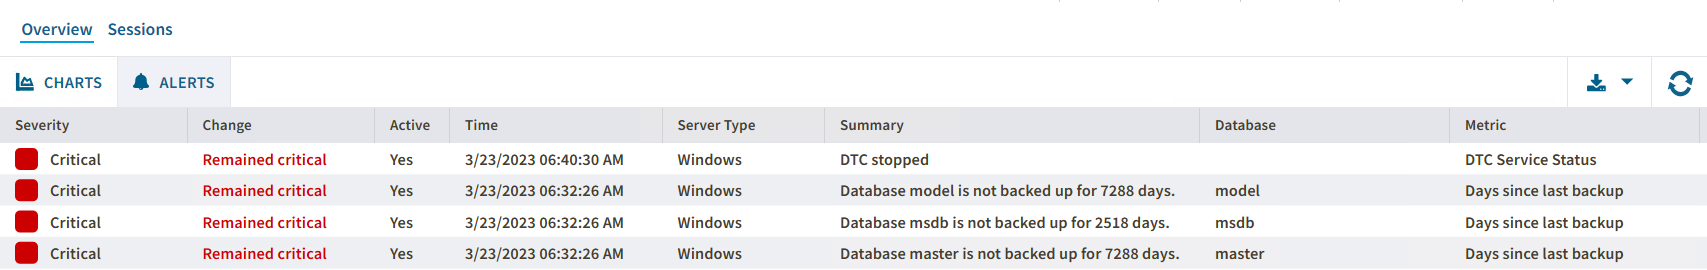
In this view, you can review and organize under the following columns Severity, Change, Active, Time, Server Typer, Summary, Database, and Metric.
Besides, you can check all the alert details in a new window with all the meaningful information by double-clicking the alert.