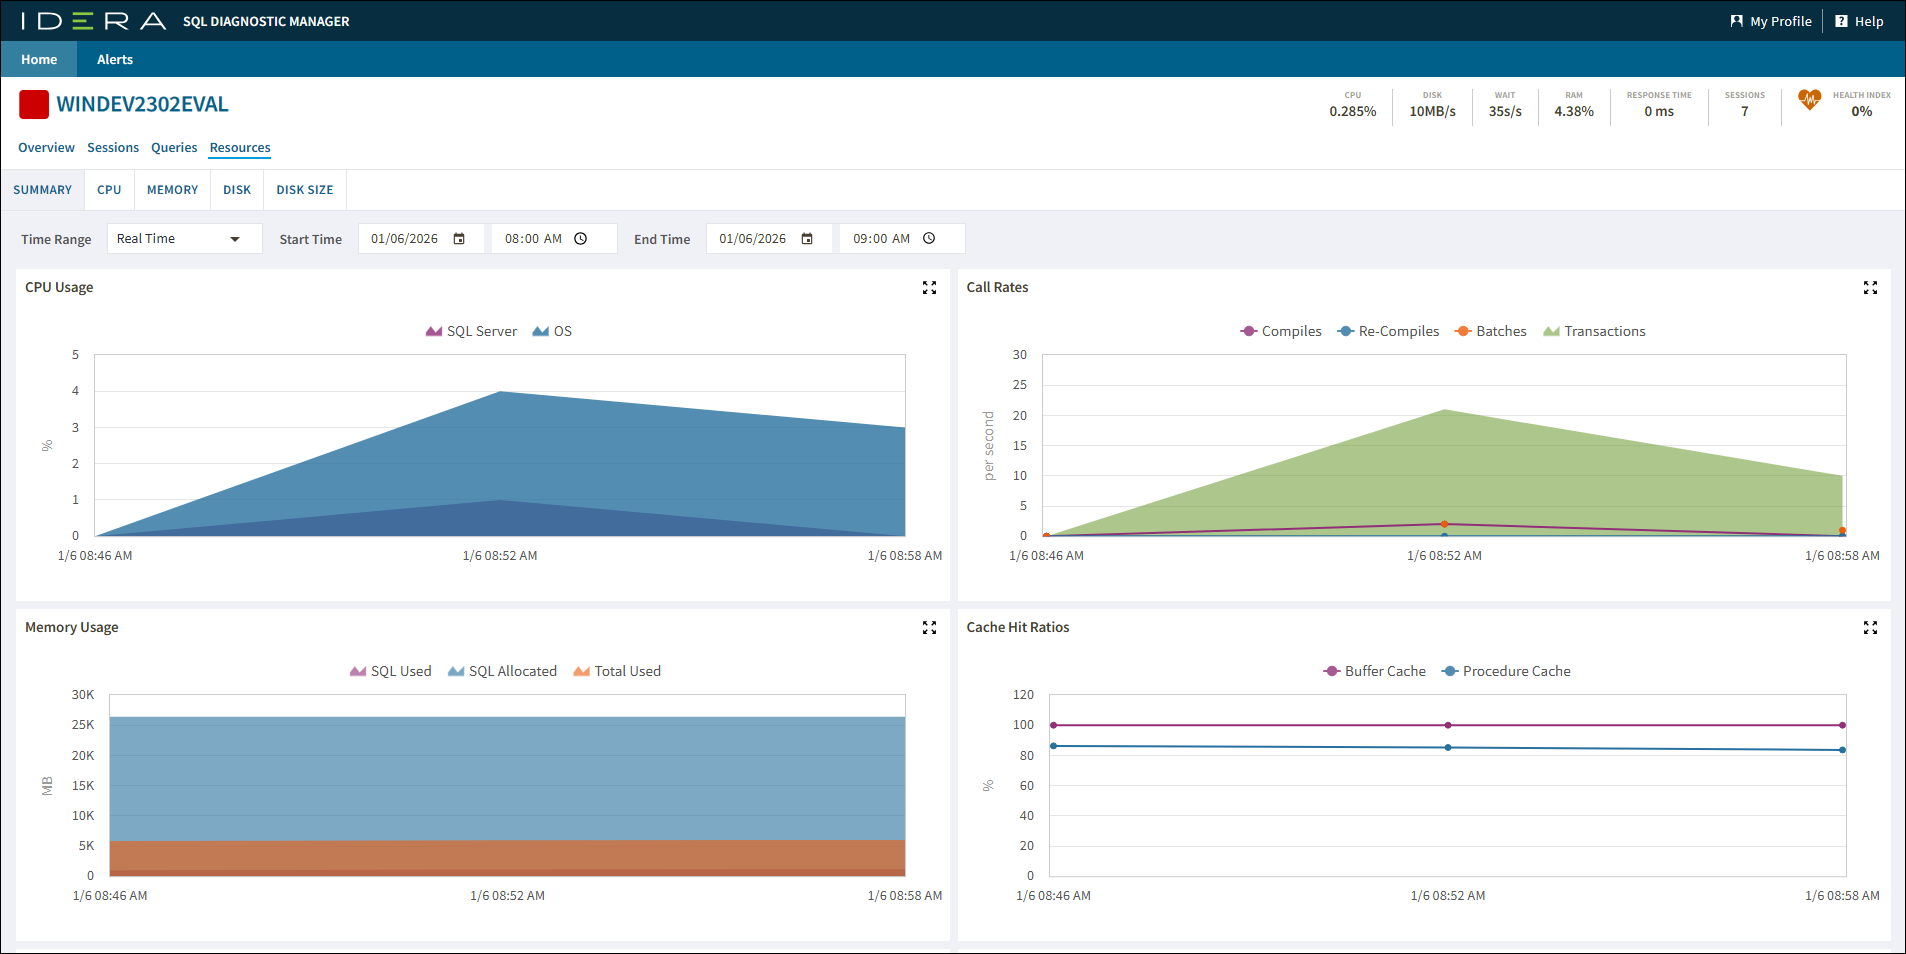
The Resources tab of the single instance dashboard allows you to monitor the system resources on the computer hosting the SQL Server instance as well as what is used by SQL Server. The Resources tab contains the following tabs:
- Monitor your system resources to avoid bottlenecks
- Monitor your system resources to avoid bottlenecks
- Monitor your system resources to avoid bottlenecks
- Monitor your system resources to avoid bottlenecks
- Disk Size
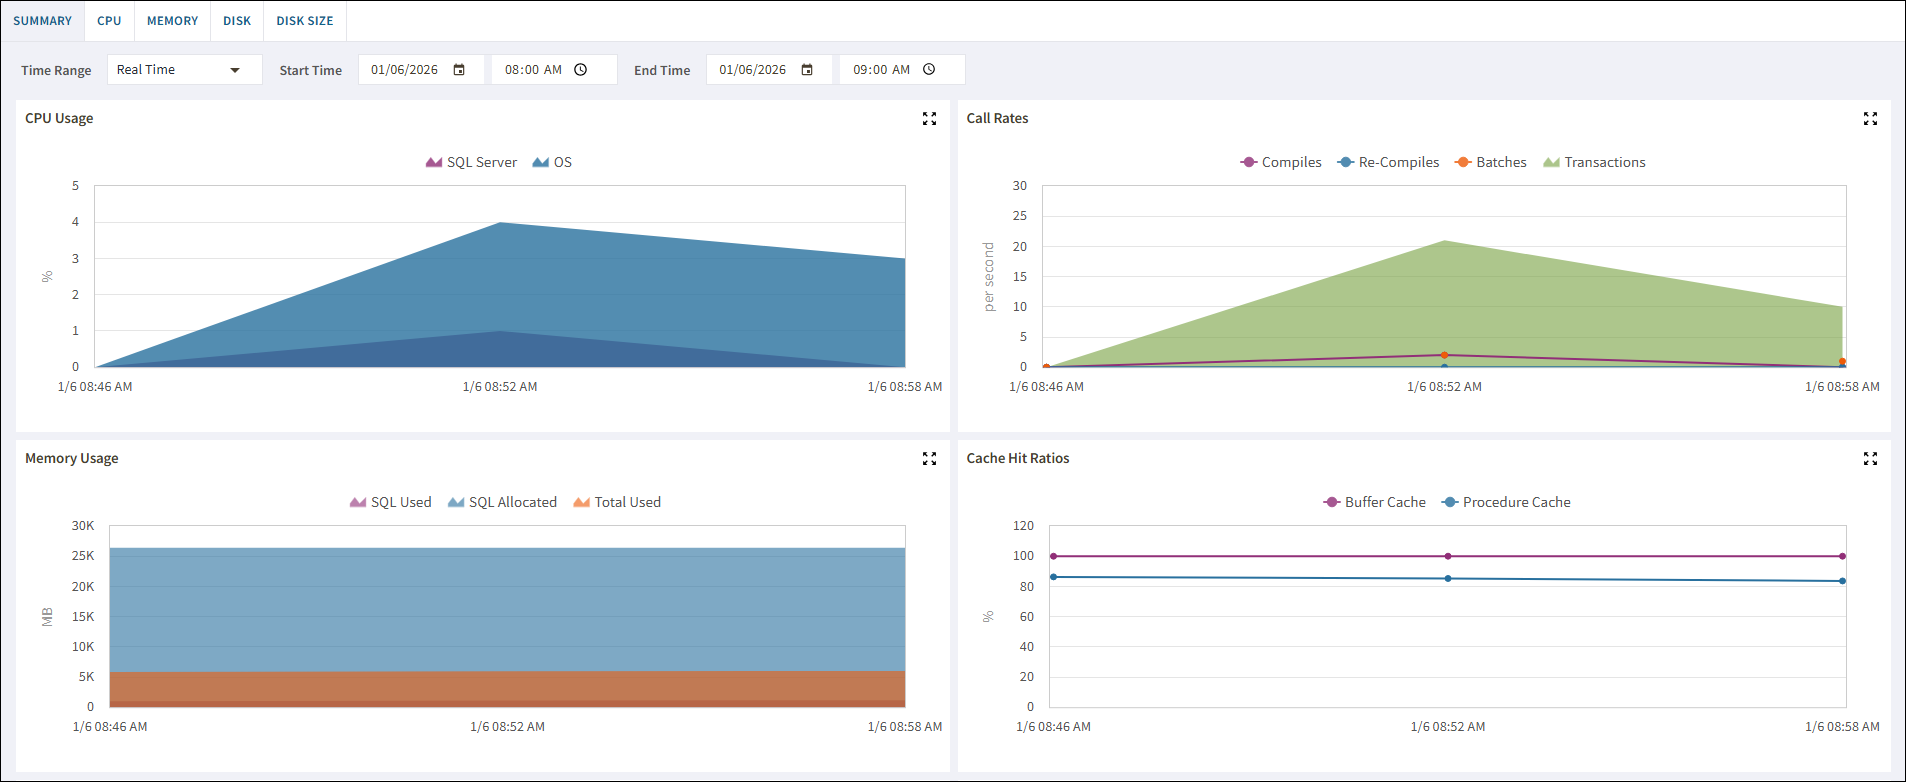
Summary
The Summary tab includes all active query information, automatically reduced to the signatures and grouped accordingly. For more information about using this view and fields, see the help topic for the desktop version at: View the query monitor signature mode.
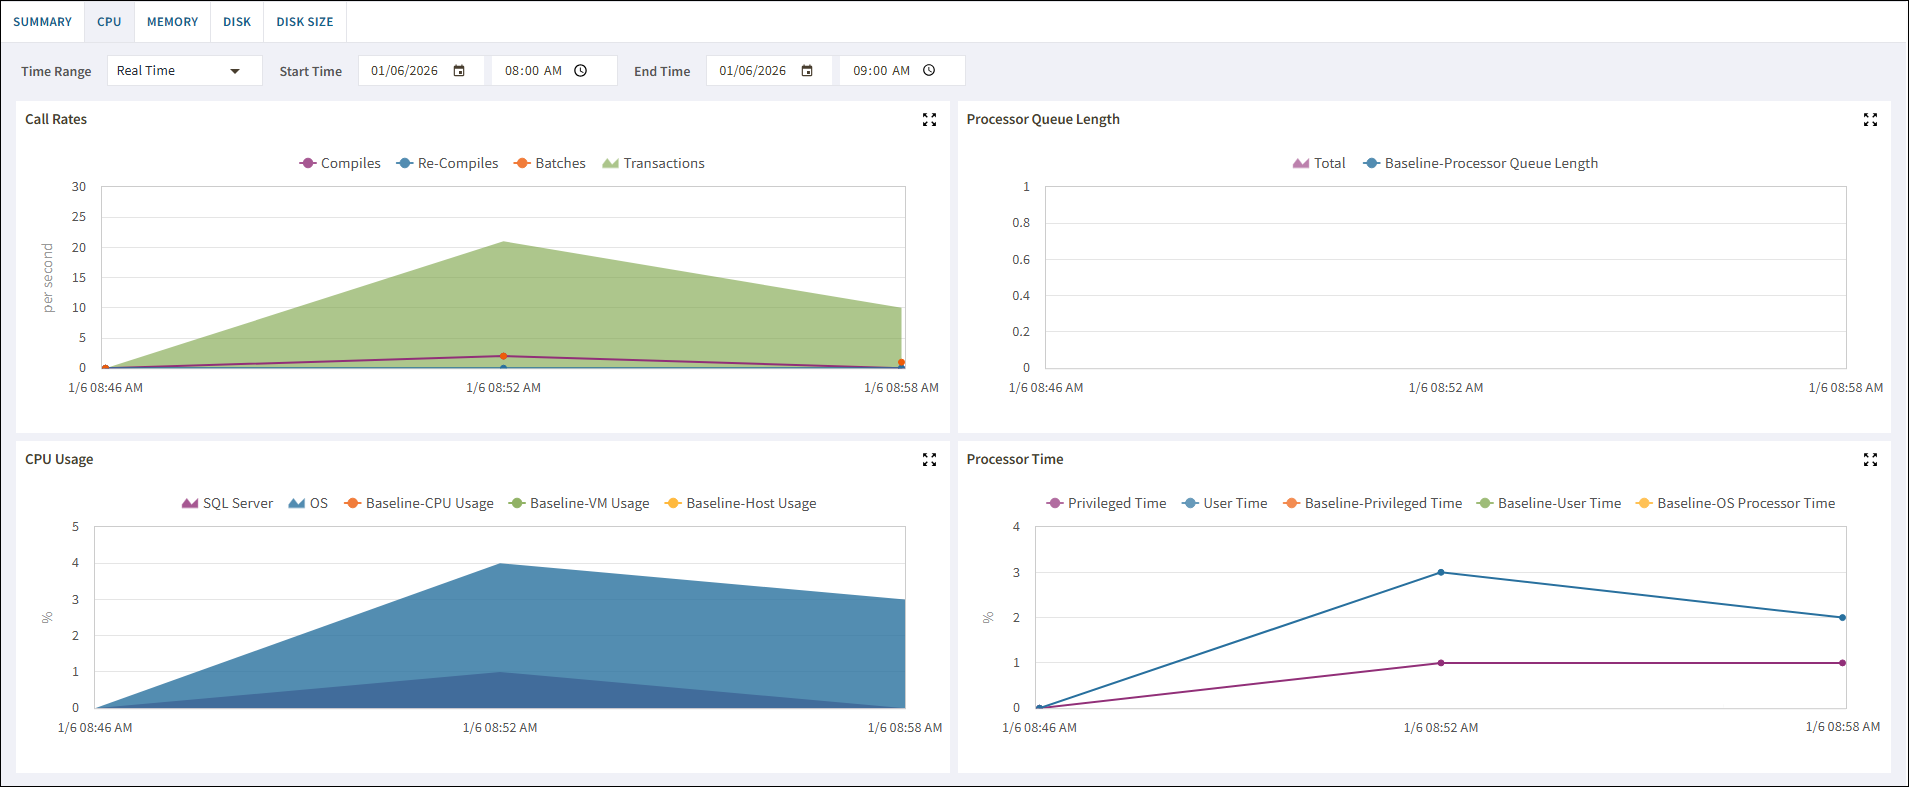
CPU
The CPU tab includes queries that are presented exactly as they are collected by the Query Monitor Trace. For more information about using this view and fields, see the help topic for the desktop version at: View the query monitor statement mode.
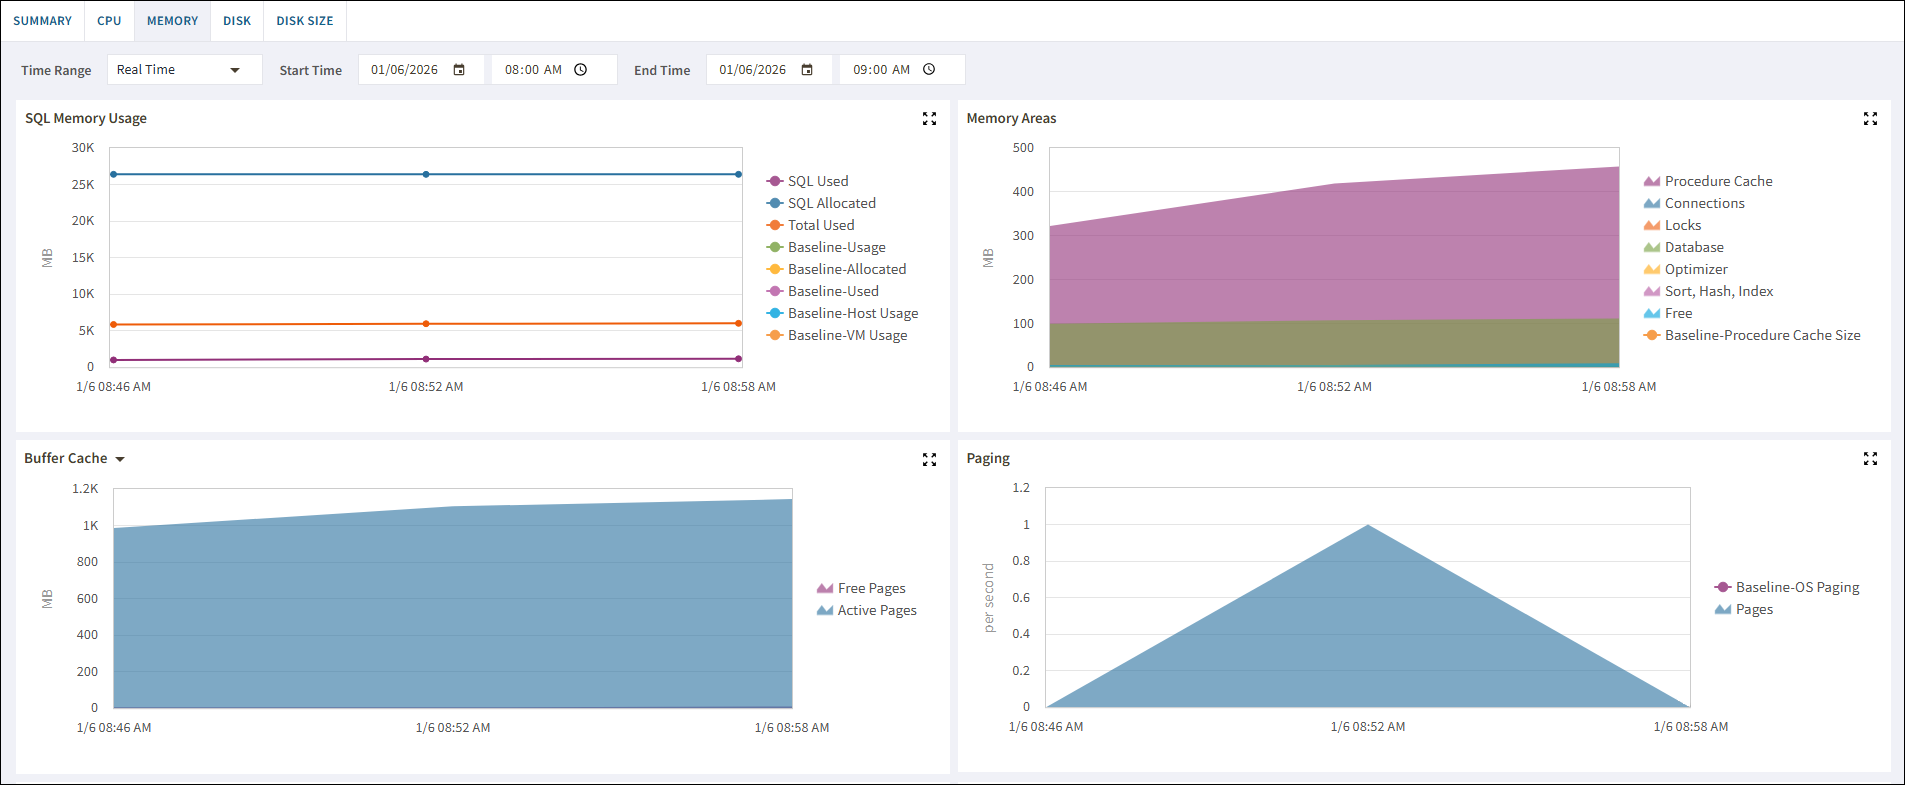
Memory
The Memory tab gives you a view of the performance of a query over time. For more information about using this view and fields, see the help topic for the desktop version at: View the query history.
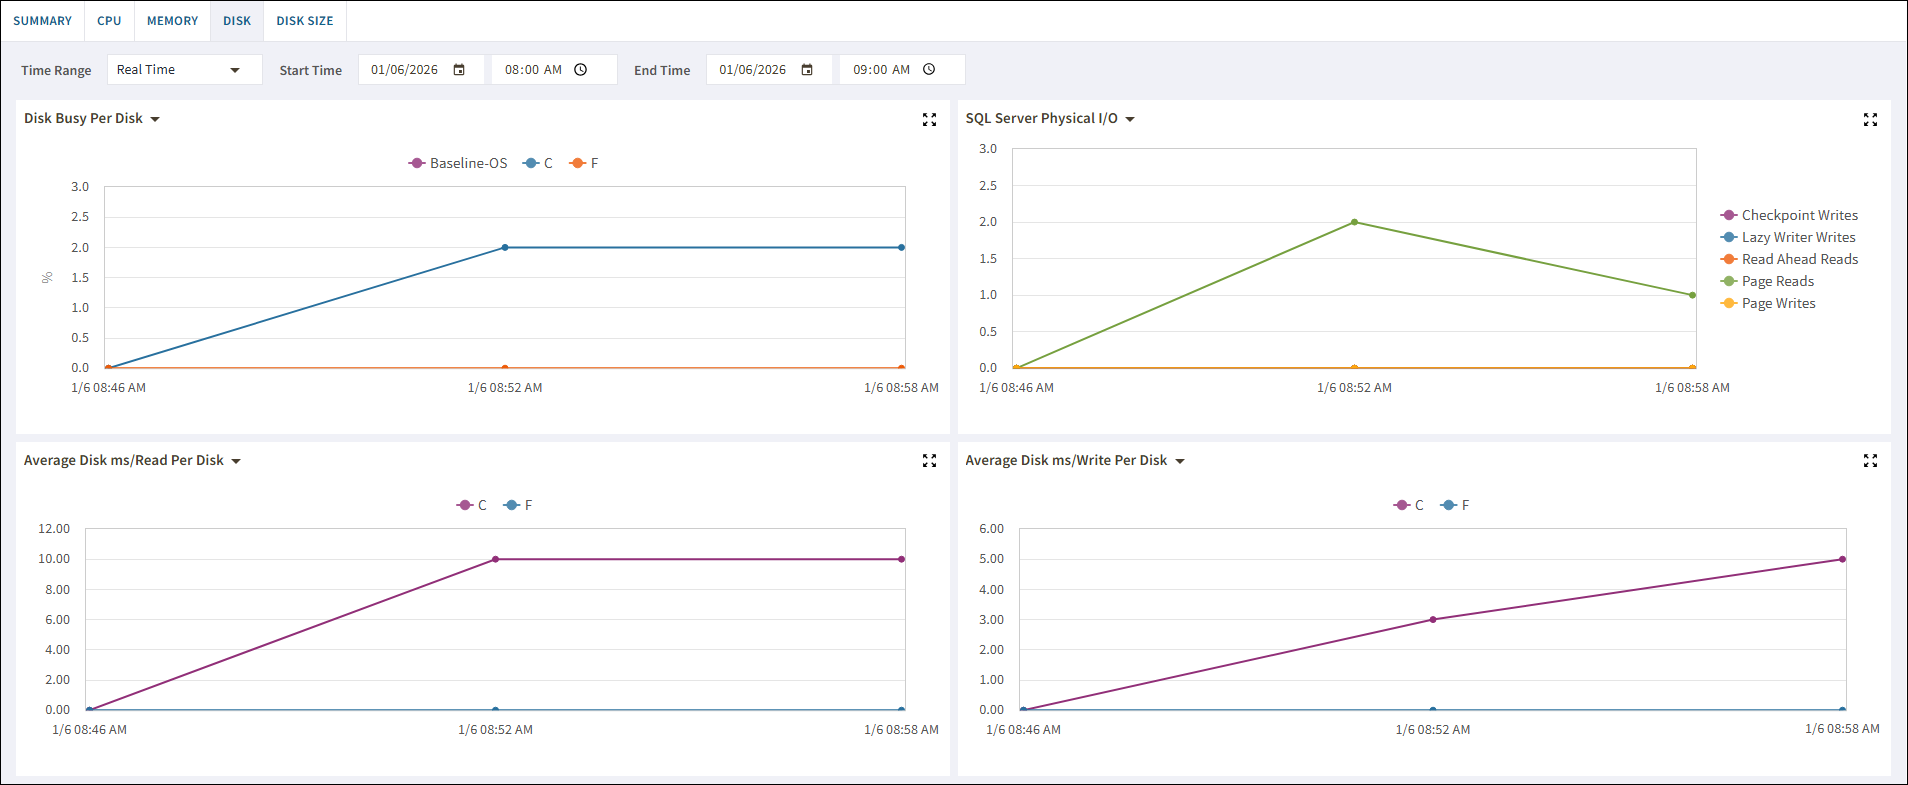
Disk
The Disk tab
The Query Waits view displays the queries on your SQL Server instance with the longest wait times. For more information about this view and fields, see the help topic for the desktop version at: View query waits.
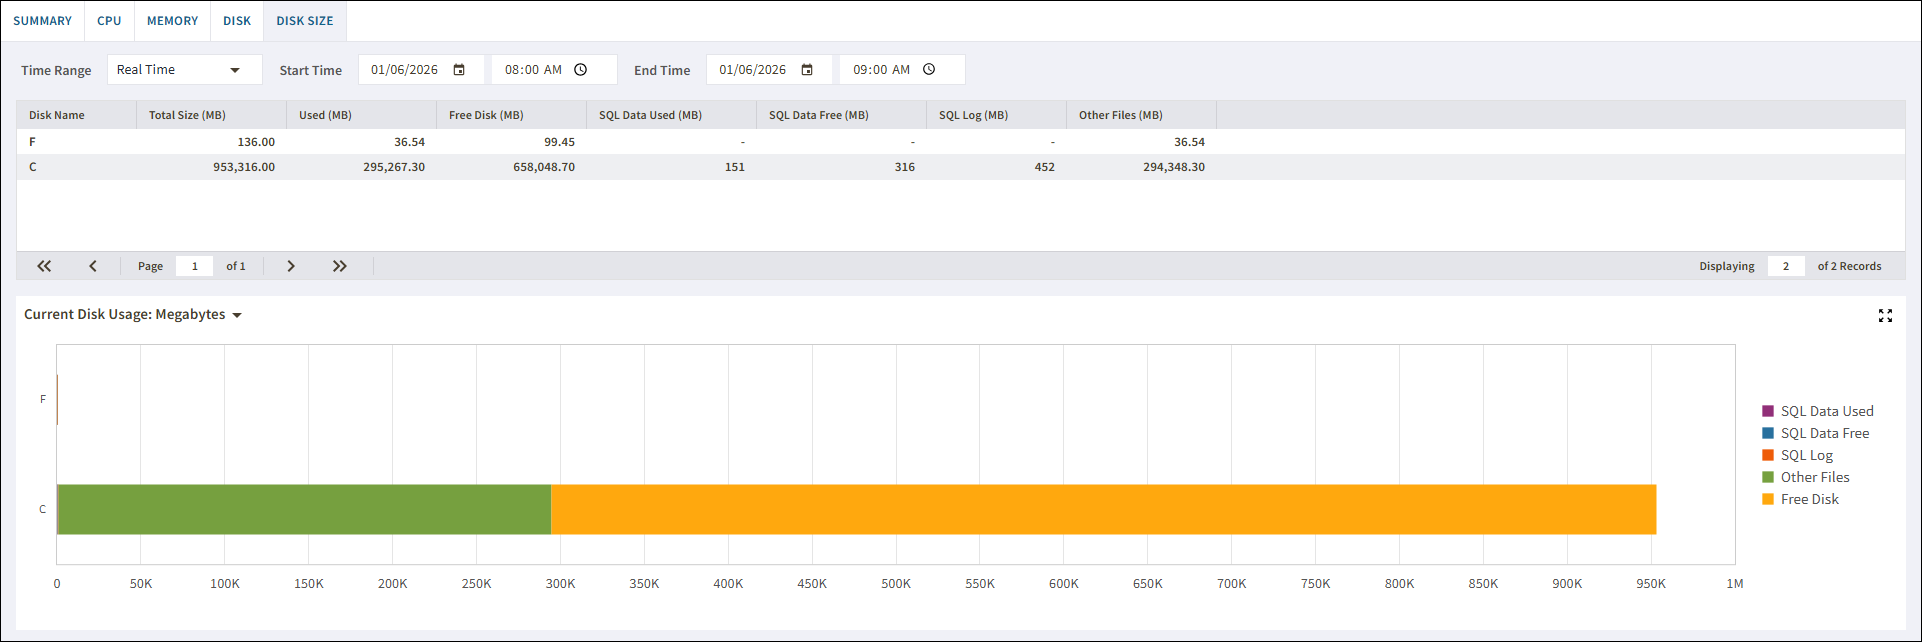
Disk Size
The Disk Size tab
The Query Waits view displays the queries on your SQL Server instance with the longest wait times. For more information about this view and fields, see the help topic for the desktop version at: View query waits.