The Navigation pane displays on the left side of the SQLDM Console as shown in the following image.
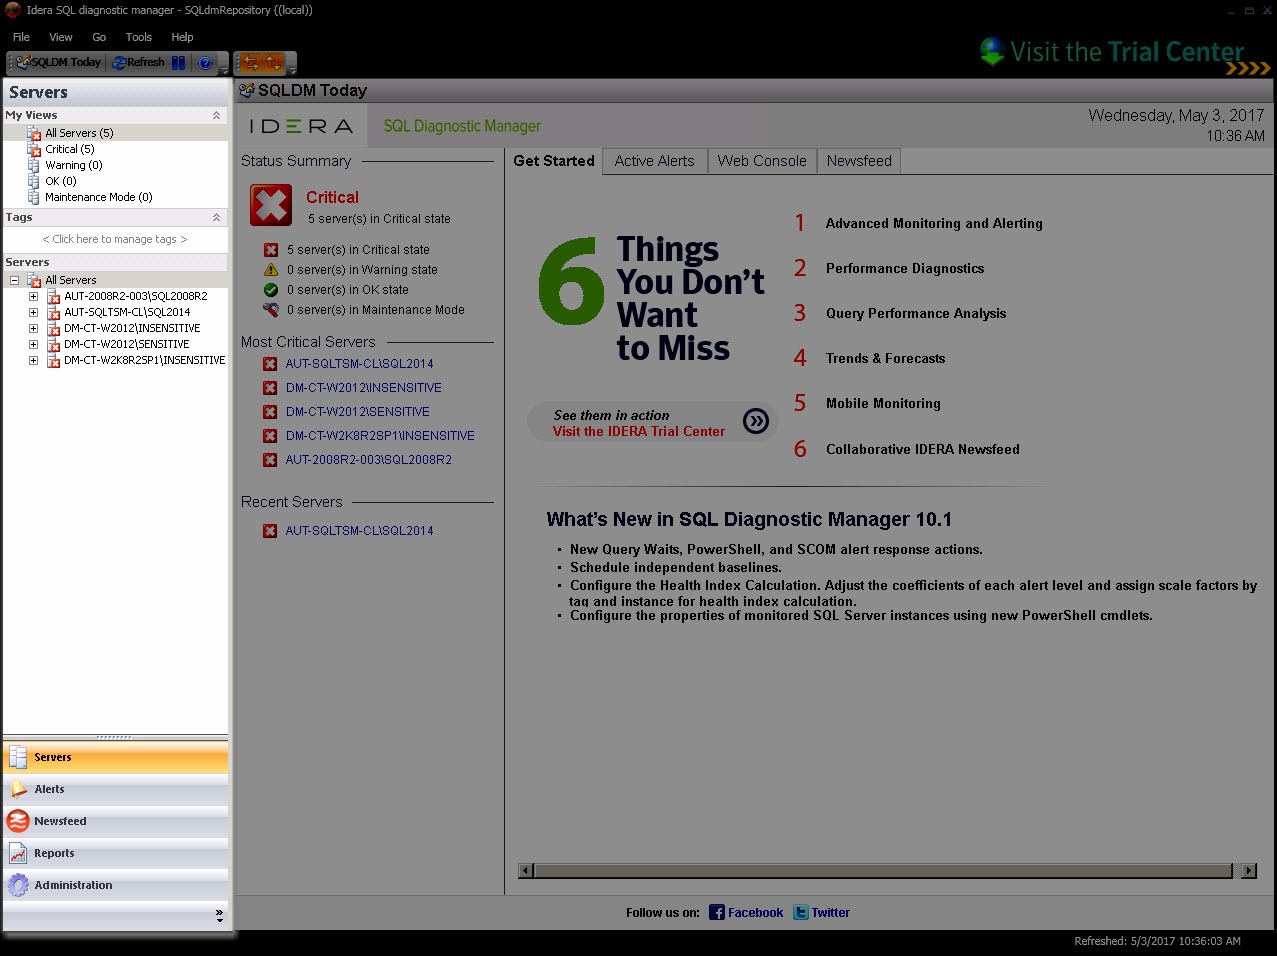
The options available on the Navigation pane change depending on the currently selected feature. You can hide the Navigation pane by selecting View > Navigation Pane > Off. The following features are available in the Navigation pane:
Servers
Contains a My Views section that helps you organize your SQL Server instances by status and includes any custom views you have set up. The Tags section allows you to manage tags or key words that you can use to quickly find the appropriate monitored SQL Server instances, custom counters, and permissions. The Servers section lists the SQL Server instances contained in the currently selected view. To view all registered instances, select All Servers from the My Views list.
Alerts
Contains filter options for organizing your alerts and links to configure alert templates, actions, and responses.
Newsfeed
If installed, the IDERA Newsfeed provides collaboration regarding your most critical SQL Server issues. If the IDERA Newsfeed is not installed, this page guides you to where you can get additional information regarding the IDERA Newsfeed.
Reports
Allows you to select the report you want to generate. SQL Diagnostic Manager provides reports for monitoring, analyzing, and planning how to best use the SQL Server instances within your environment.
Administration
Allows you to control access to SQL Diagnostic Manager, add custom counters for monitoring, and keep track of key actions performed in your SQL Diagnostic Manager environment.