SQL Diagnostic Manager allows users to enable alerts when the following metrics are outside their established baseline thresholds:
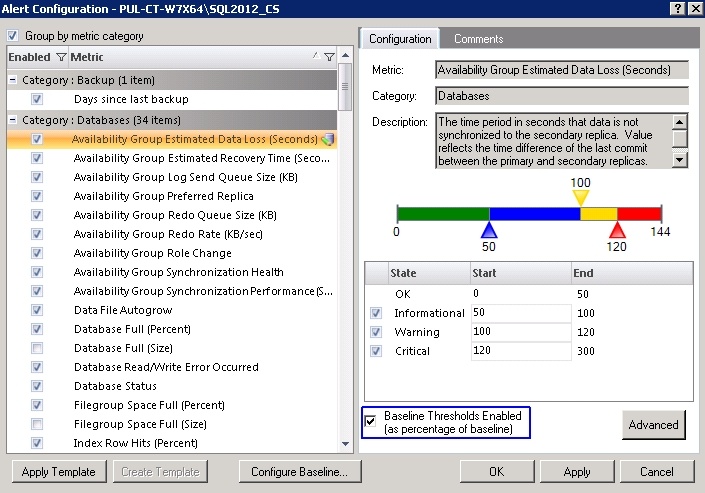
Availability Group Estimated Data Loss (Seconds)
Availability Group Estimated Recovery Time (Seconds)
Availability Group Log Send Queue Size (KB)
Availability Group Redo Queue Size (KB)
Availability Group Redo Rate (KB/sec)
Availability Group Synchronization Performance (Seconds)
SQL Server Data Used (Percent)
SQL Server Log Used (Percent)
OS Average Disk Queue Length (Count)
OS Disk Time (Percent)
OS Memory Usage (Percent)
OS Paging (Per Second)
OS Privileged Time (Percent)
OS Processor Queue Length (Count)
OS Processor Time (Percent)
OS User Time (Percent)
Page Life Expectancy
Procedure Cache Hit Ratio
SQL Server CPU Usage (Percent)
SQL Server Memory Usage (Percent)
Non-Distributed Transactions (Count)
Unsubscribed Transactions (Count)
Unsubscribed Transactions (Seconds)
Blocked Sessions (Count)
Client Computers (Count)
Oldest Open Transaction (Minutes)
SQL Server Response Time (Miliseconds)
User Connections (Percent)
VM CPU Usage (Percent)
To enable baseline thresholds:
- Right-click a monitored SQL Server instance and select Configure Alerts.
- In the Alert Configuration window, click the Baseline Thresholds Enabled (as percentage of baseline) check box.