The Advanced Query Monitor Configuration window allows you to supply filtering criteria such as including or excluding specific applications, databases, and SQL text from the Query Monitor Trace collection. Filtering allows you to improve the results you see in the Query Monitor view and reduce the impact of the Query Monitor trace on your server.
You can also configure these options directly from the new advanced query views in the SQL Diagnostic Manager web console. See View your SQL Server queries information .
Access the Advanced Query Monitor Configuration window
You can access the Advanced Query Monitor Configuration window (click image to view full size) by right-clicking the appropriate monitored SQL Server instance, and then selecting Properties. Click Query Monitor when SQL Diagnostic Manager displays the Monitored SQL Server Properties window, and then click Advanced.
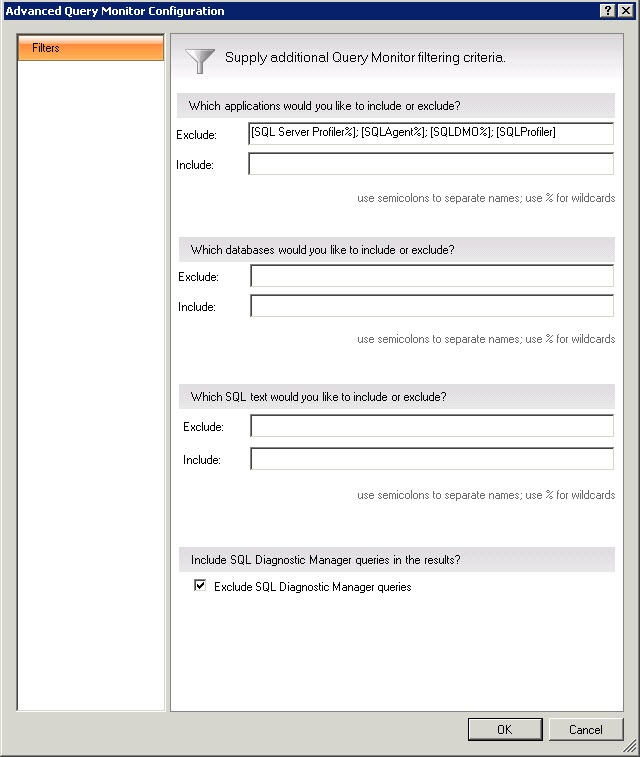
When using Query Monitor filtering, take into account that Exclude takes precedence over Include.
Using Query Monitor exclusion filtering
Excluding data from your Query Monitor trace helps filter out information that is not important for the task at hand. SQL Diagnostic Manager allows you to filter specific applications, databases, or SQL text and also exclude the SQL Diagnostic Manager queries from the results. When adding multiple items to exclude, use a semi-colon (;) between items of the same type. You can also use a percent character (%) as a wildcard.
To exclude data from your Query Monitor trace while in the Queries view:
- On the Queries view for the server you want to exclude data from, press the Configure Query Monitor button.
- Click Advanced.
- Enter your filter information in the Exclude fields, using (;) to separate items and (%) as a wildcard.
- Click OK.
Using Query Monitor inclusion filtering
SQL Diagnostic Manager allow you to set Query Monitor inclusion filters. You can choose the applications, databases, and SQL text you want to include in the Query Monitor trace and SQL Diagnostic Manager stores only queries that match these inclusion filtering criteria. When adding multiple items to include, use a semi-colon (;) between items of the same type. You can also use a percent character (%) as a wildcard.
To include data in your Query Monitor trace while in the Queries view:
- On the Queries view for the server you want to include data in, press the Configure Query Monitor button.
- Click Advanced.
- Enter your filter information in the Include fields, using (;) to separate items and (%) as a wildcard.
- Click OK.