The Sessions tab of the single instance dashboard allows you to quickly view key diagnostic statistics for sessions on your SQL Server instance and contains the Overview and Session Graphs views. Click image to view full size.
You can launch SQL Workload Analysis from the single instance view and its tabs of the SQLDM web console. The icon Launch SWA located on the top-right side of the screen is available when your instance is registered in SQL Workload Analysis product.
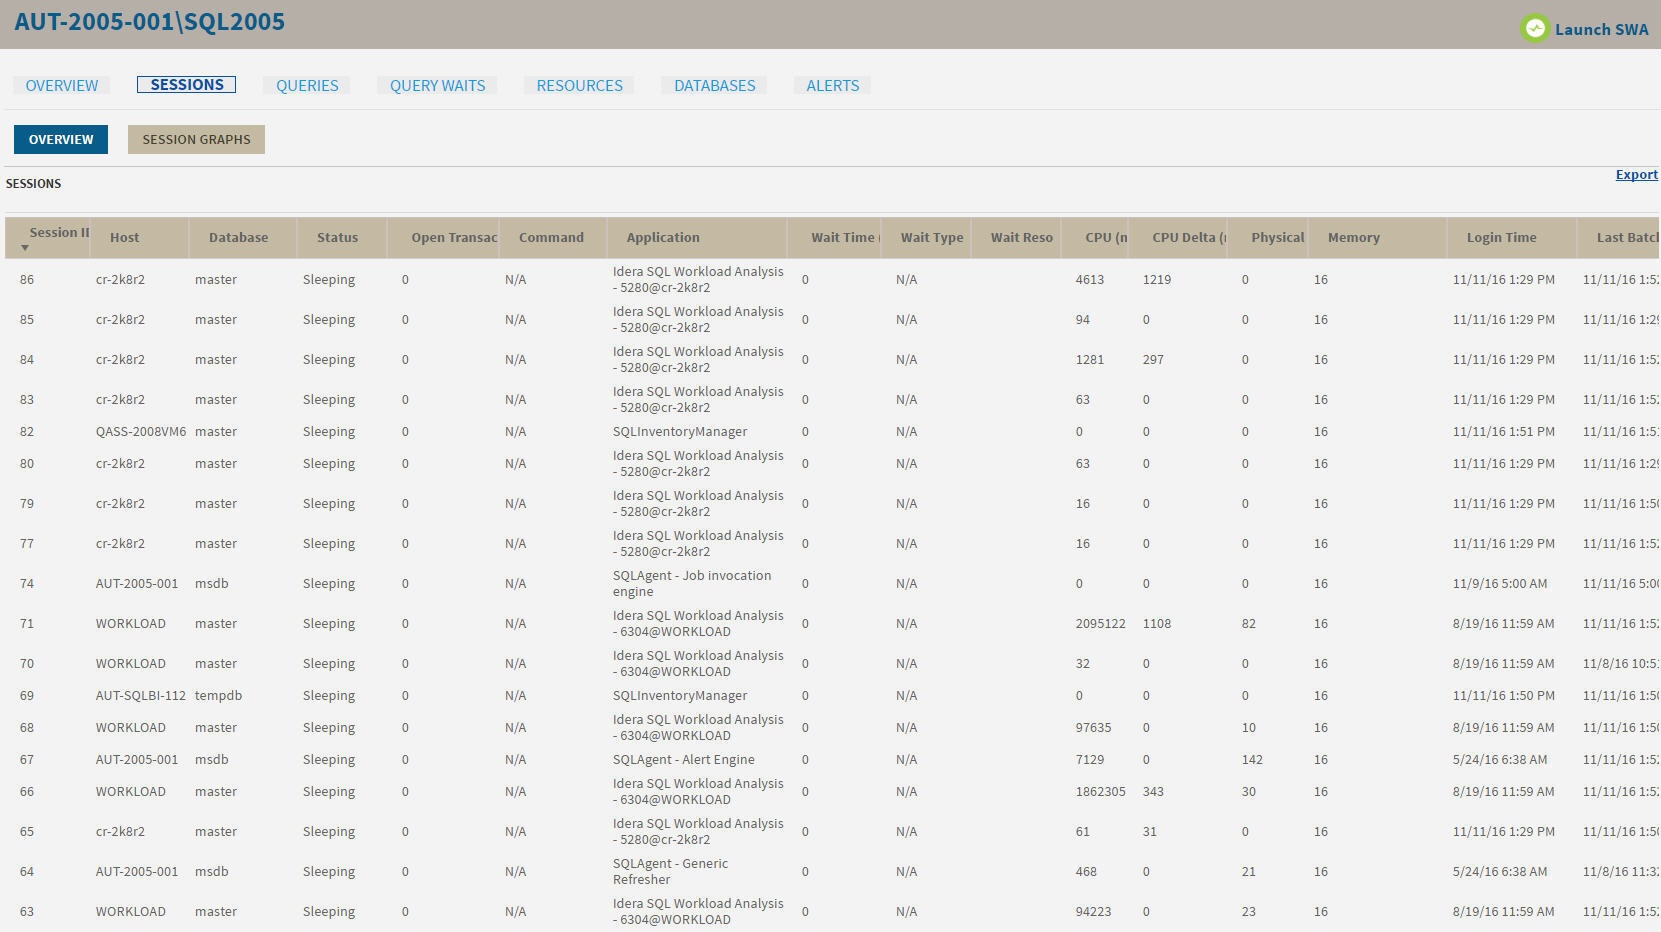
Overview
The Sessions > Overview tab contains the following information:
- Session ID
- Host
- Database
- Status
- Open transactions
- Command
- Application
- Wait time (ms)
- Wait type
- Wait resources
- CPU (ms)
- CPU Delta (ms)
- Physical I/O
- Memory
- Login time
- Last Batch
- Blocked by
- Blocking
- Blocking count
- Net address
- Net library
- Version store elapsed (sec)
Export
You can export sessions overview information in the following formats: PDF, XLS, or XML.
Session Graphs
The Sessions > Sessions Graphs tab contains the following charts (Click image to view full size):
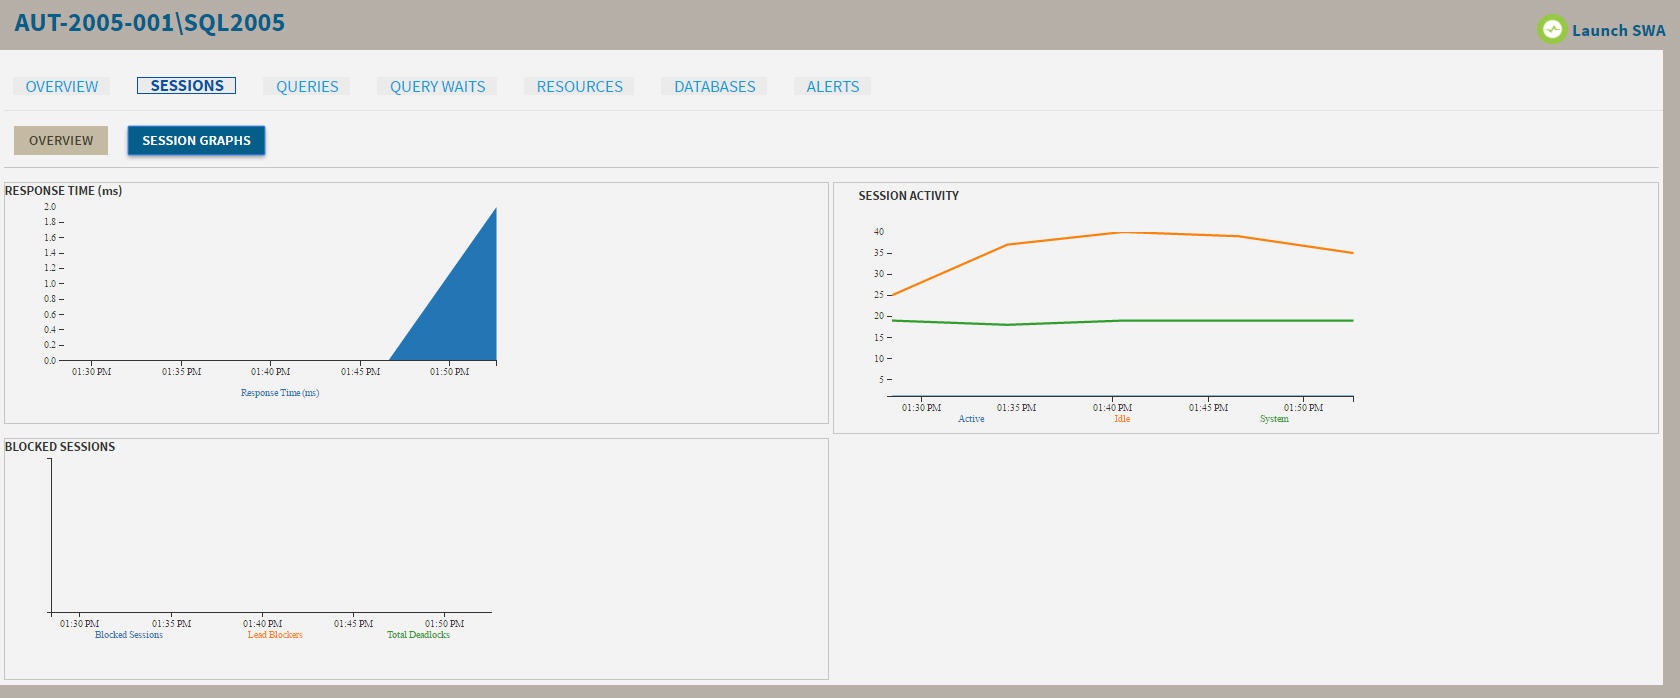
Response Time (ms)
The Response Time chart displays the response time (in milliseconds) it takes a Select SQL statement to go to the SQL Server instance and back. This chart indicates the current speed and congestion of the network as well as the speed with which SQL Server processes small queries.
Session Activity
The Session Activity chart displays the number of concurrent connections to the monitored SQL Server instance over time. The total number of sessions includes the active, idle, and system sessions.
Blocked Sessions
The Blocked Sessions charts lists all the Blocked Sessions, Lead Blockers, and the Total Deadlocks for the selected SQL Server instance. This allows you to easily view blocks as they occur.
Access the Sessions tab
SQL Diagnostic Manager provides three paths to access the Sessions tab. The first access path is by clicking on the Response Time chart (ms) of the single instance dashboard, and you are directed to the Sessions > Overview tab. The second access path is by selecting the Sessions tab of the single instance dashboard. You can also click on an alert that belongs to the Sessions category in the Active alerts panel of the main dashboard.