The list view displays all matching objects for the view selection and grouping in the Main Query view. The following list options are available:
Application list
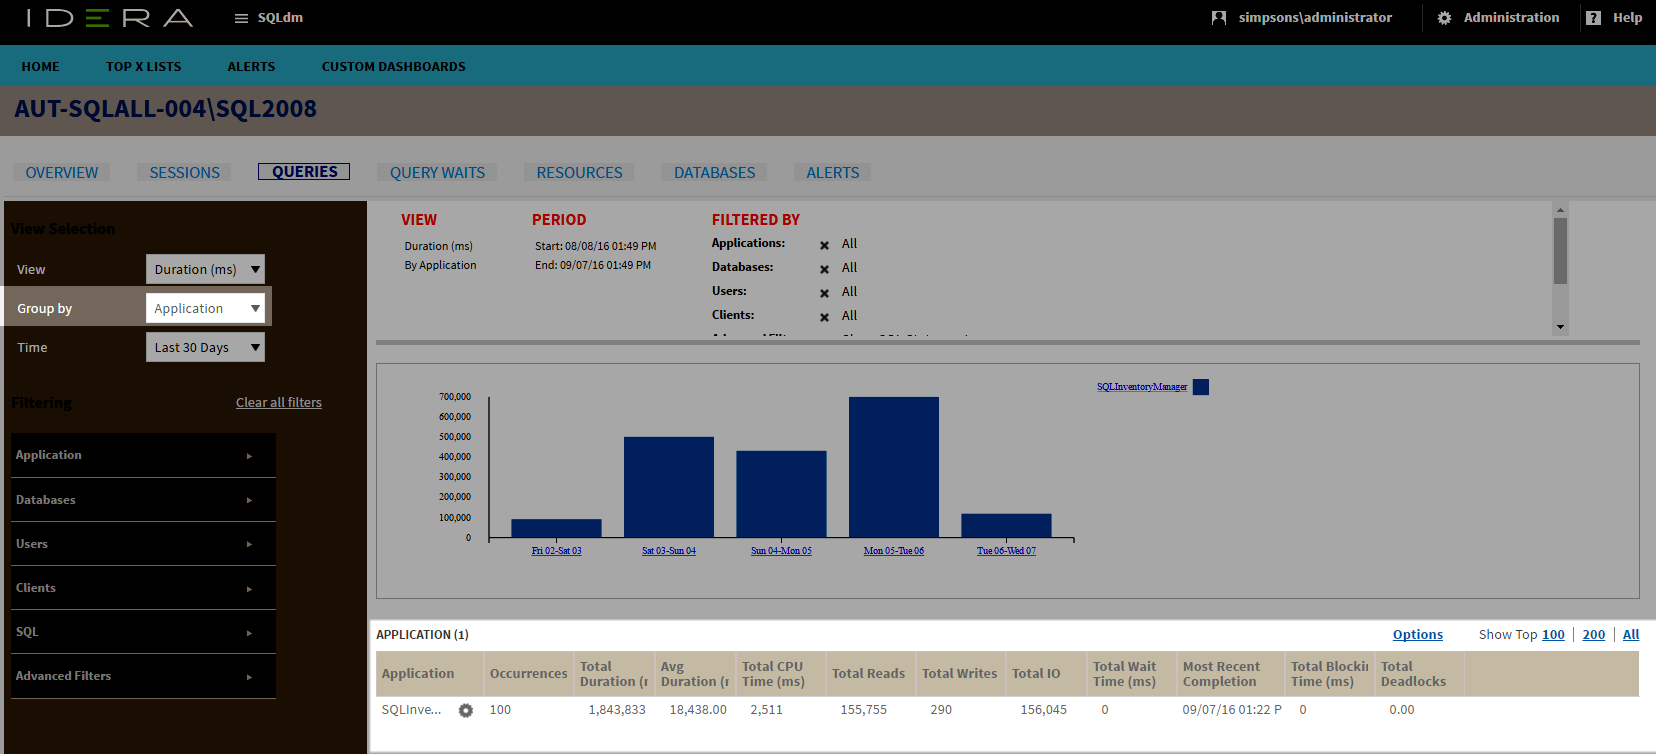
The application list displays data that results from grouping by Application in the View Selection of the Main Query view. The application list provides you with the following information by default:
- Application
- Occurrences
- Total Duration (ms)
- Average Duration (ms)
- Total CPU Time (ms)
- Total Reads
- Total Writes
- Total I/O
- Total Wait Time (ms)
- Most Recent Completion
- Total Blocking Time (ms)
- Total Deadlocks
You can add or remove columns through the Column Chooser under Options.
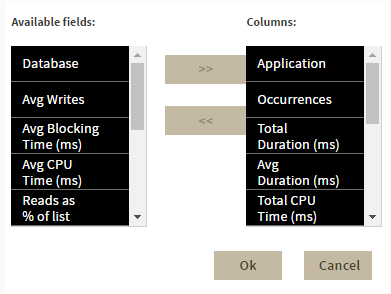
- Database
- Average Writes
- Average Blocking Time (ms)
- Average CPU Time (ms)
- Reads as % of list
- Average I/O
- CPU as % of list
- Average Reads
- Average CPU Per Second
- Average Deadlocks
- Average Wait Time (ms)
Records
You can display the top 100, 200, or all records by clicking the different Show Top options.
In the Main Query view, after selecting the CPU Time (ms) by Application view. The CPU as % of list metric provides the CPU as a percentage of the values returned in the application list. For example, if you have three applications returned with a total CPU Time (ms) of 600, then the CPU as % of list metric for each is calculated as follows:
Application 1- CPU Time (ms): 100; (100/600) *100 = 16.7% of total application CPU.
Application 2- CPU Time (ms): 200; (200/600) *100 = 33% of total application CPU.
Application 3- CPU Time (ms): 300; (300/600) *100 = 50% of total application CPU.
The CPU as % of list metric helps to pinpoint which application in your list has the highest CPU Time percentage (Application 3).
To drill down for additional query information, you can click the gear icon in the list and the following context menu displays:
- Query Signature. Click this option to view query signatures for the selected application.
- Query Statement. Click this option to view query statements for the selected application.
To access the Query Signature view, you can also click the linkable application name (e.g. Microsoft SQL Server) in the application list.
Database list
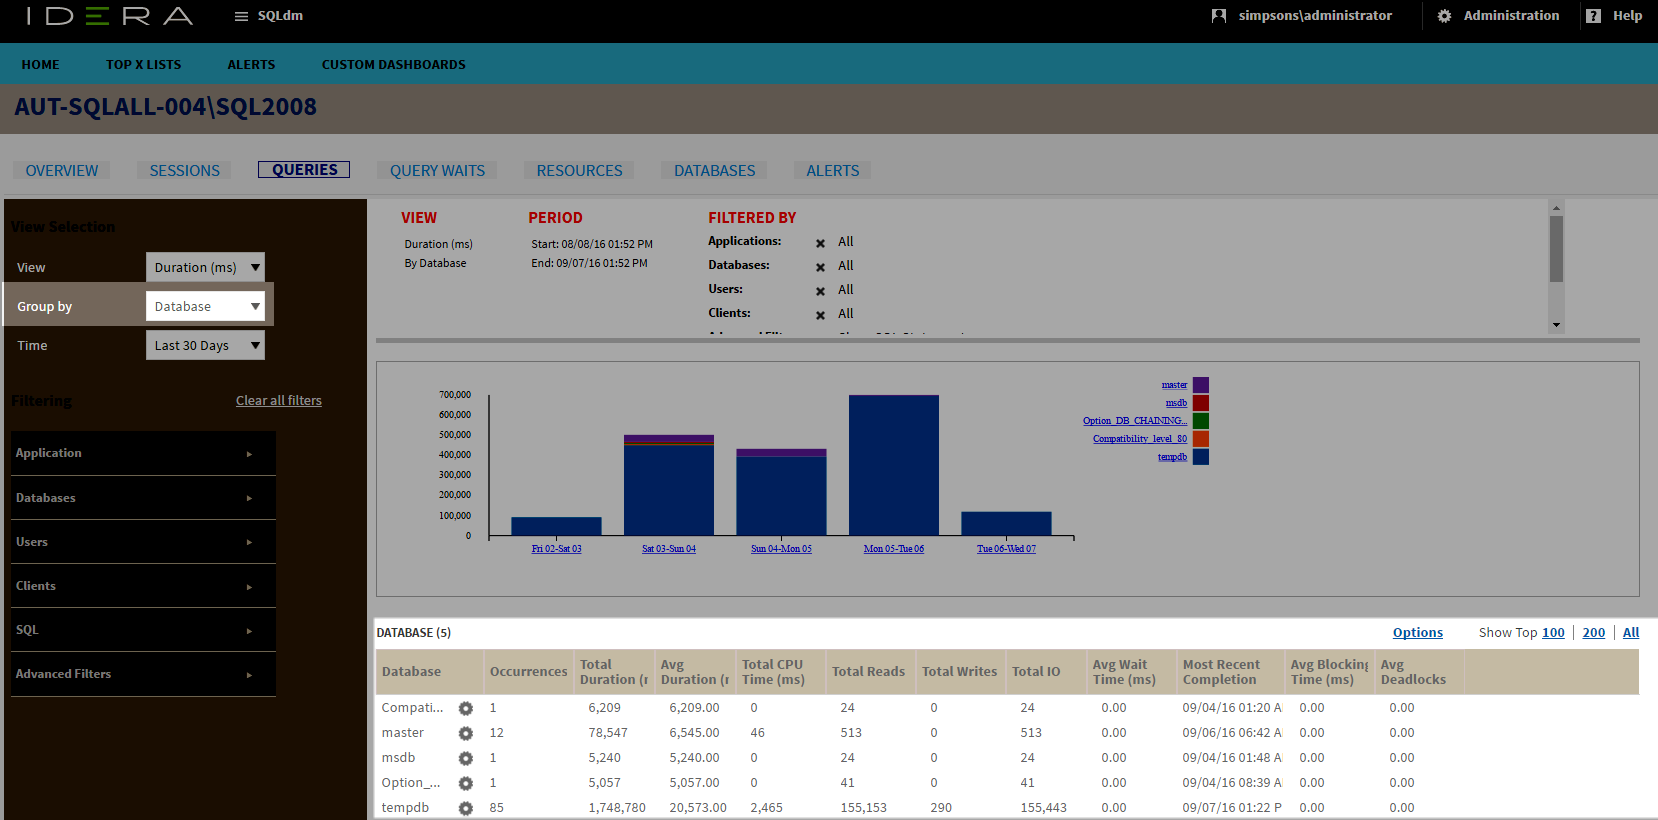
The database list displays data that results from grouping by Database in the View Selection of the Main Query view. The database list provides you with the following information by default:
- Database
- Occurrences
- Total Duration (ms)
- Average Duration (ms)
- Total CPU Time (ms)
- Total Reads
- Total Writes
- Total I/O
- Average Wait Time (ms)
- Most Recent Completion
- Average Blocking Time (ms)
- Average Deadlocks
Additional columns are available through the Column Chooser under Options.
- Average Writes
- Total Blocking Time (ms)
- Average CPU Time (ms)
- Reads as % of list
- Total Wait Time (ms)
- Average I/O
- Total Deadlocks
- CPU as % of list
- Average Reads
- Average CPU Per Second
- Application
To drill down for additional query information, you can click the gear icon in the list and the following context menu displays:
- Query Signature. Click this option to view query signatures for the selected database.
- Query Statement. Click this option to view query statements for the selected database.
Records
You can display the top 100, 200, or all records by clicking the different Show Top options.
To access the Query Signature view, you can also click the linkable database name in the database list.
User list
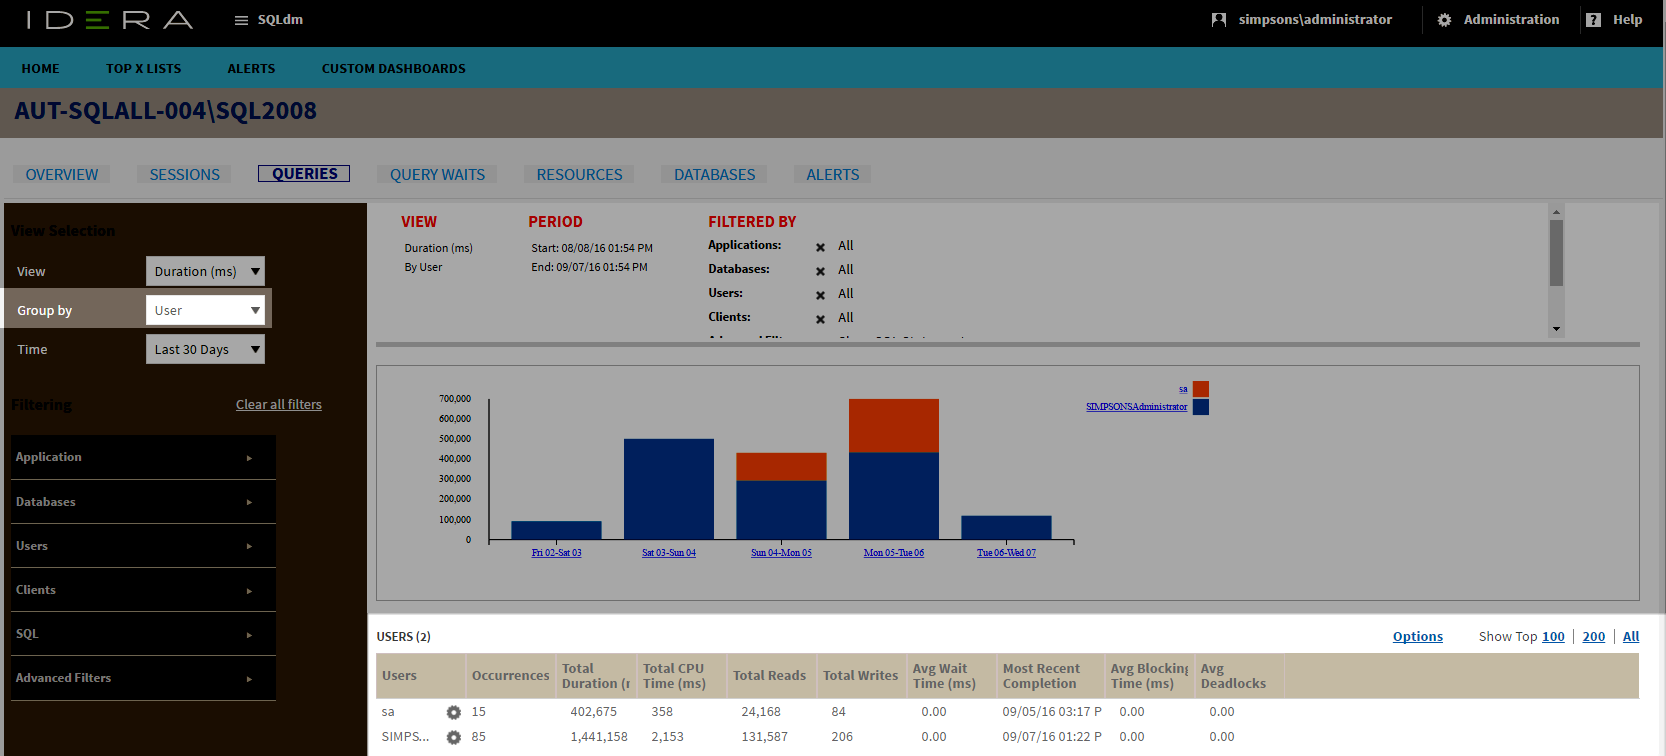
The user list displays data that results from grouping by the user in the View Selection of the Main Query view. The user list provides you with the following information by default:
- Users
- Occurrences
- Total Duration (ms)
- Total CPU Time (ms)
- Total Reads
- Total Writes
- Average Wait Time (ms)
- Most Recent Completion
- Average Blocking Time (ms)
- Average Deadlocks
Additional columns are available through the Column Chooser under Options:
- Database
- Average Writes
- Total Blocking Time (ms)
- Average Duration (ms)
- Average CPU Time (ms)
- Reads as % of list
- Total Wait Time (ms)
- Average I/O Per Second
- Total Deadlocks
- CPU as % of list
- Average Reads
- Average CPU Per Second
- Application
To drill down for additional query information, you can click the gear icon in the list and the following context menu displays:
- Query Signature. Click this option to view query signatures for the selected user.
- Query Statement. Click this option to view query statements for the selected user.
Records
You can display the top 100, 200 or all records by clicking the different Show Top options.
To access the Query Signature view, you can also click the linkable username in the user list.
Client list
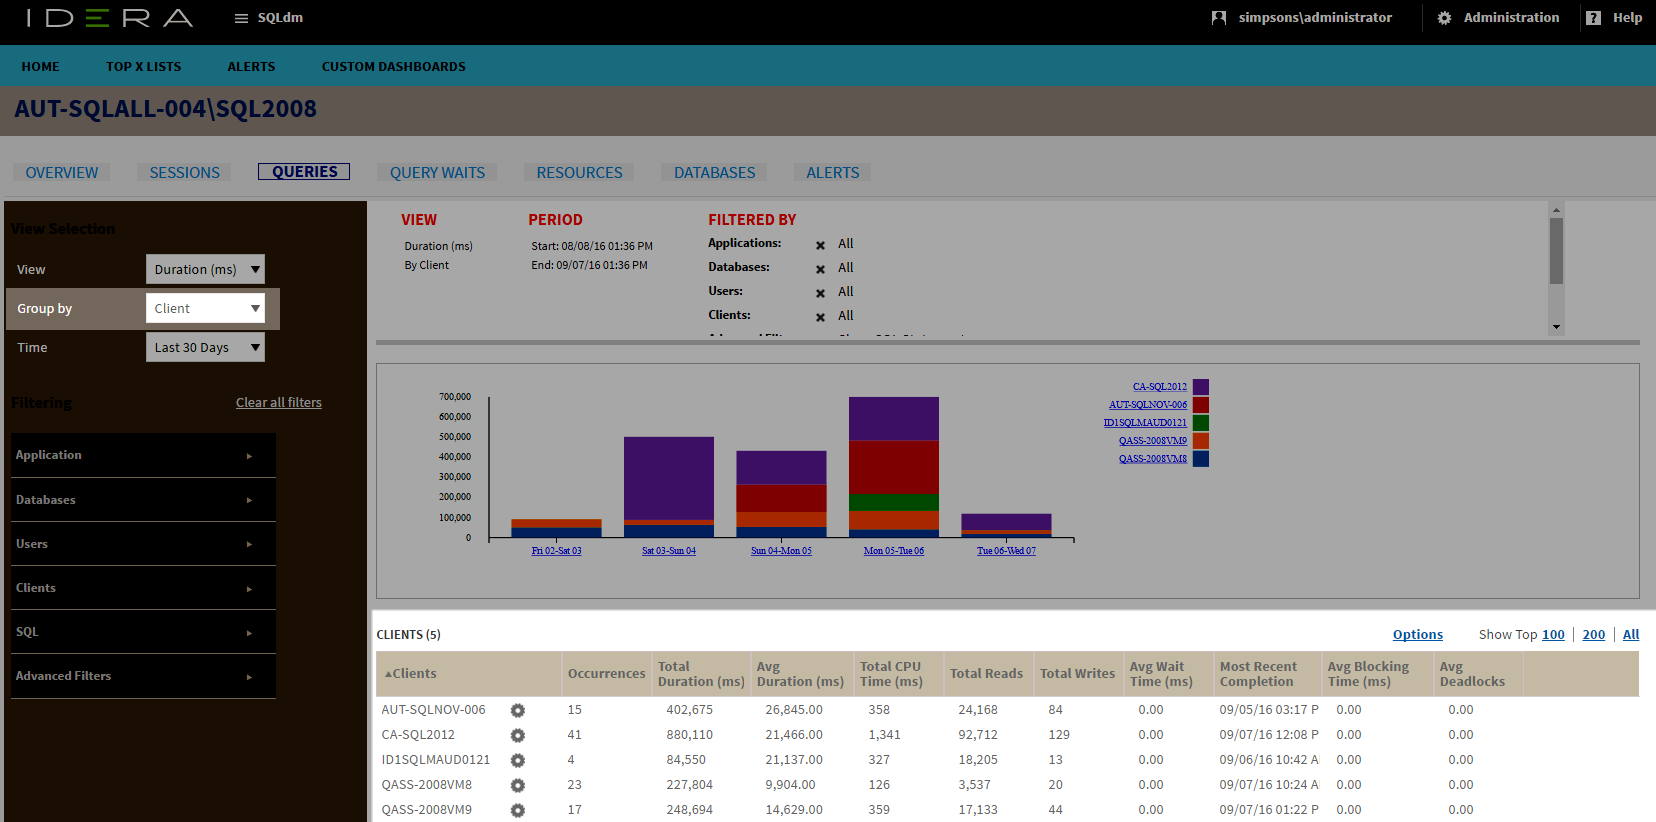
The client list is the data displayed after you selected Group By Clients in the View Selection of the Main Query view. The client list provides you with the following information by default:
- Clients
- Occurrences
- Total Duration (ms)
- Average Duration (ms)
- Total CPU Time (ms)
- Total Reads
- Total Writes
- Average Wait Time (ms)
- Most Recent Completion
- Average Blocking time (ms)
- Average Deadlocks
Additional columns are available through the Column Chooser under Options.
- Database
- Average Writes
- Total Blocking Time (ms)
- Average CPU Time (ms)
- Reads as % of list
- Total Wait Time (ms)
- Average I/O Per Second
- Total Deadlocks
- CPU as % of list
- Average Reads
- Average CPU Per Second
- Application
To drill down for additional query information, you can click the gear icon in the list and the following context menu displays:
- Query Signature. Click this option to view query signatures for the selected client.
- Query Statement. Click this option to view query statements for the selected client.
Records
You can display the top 100, 200 or all records by clicking the different Show Top options.
To access the Query Signature view, you can also click the linkable client name in the client list.
Query Signature list
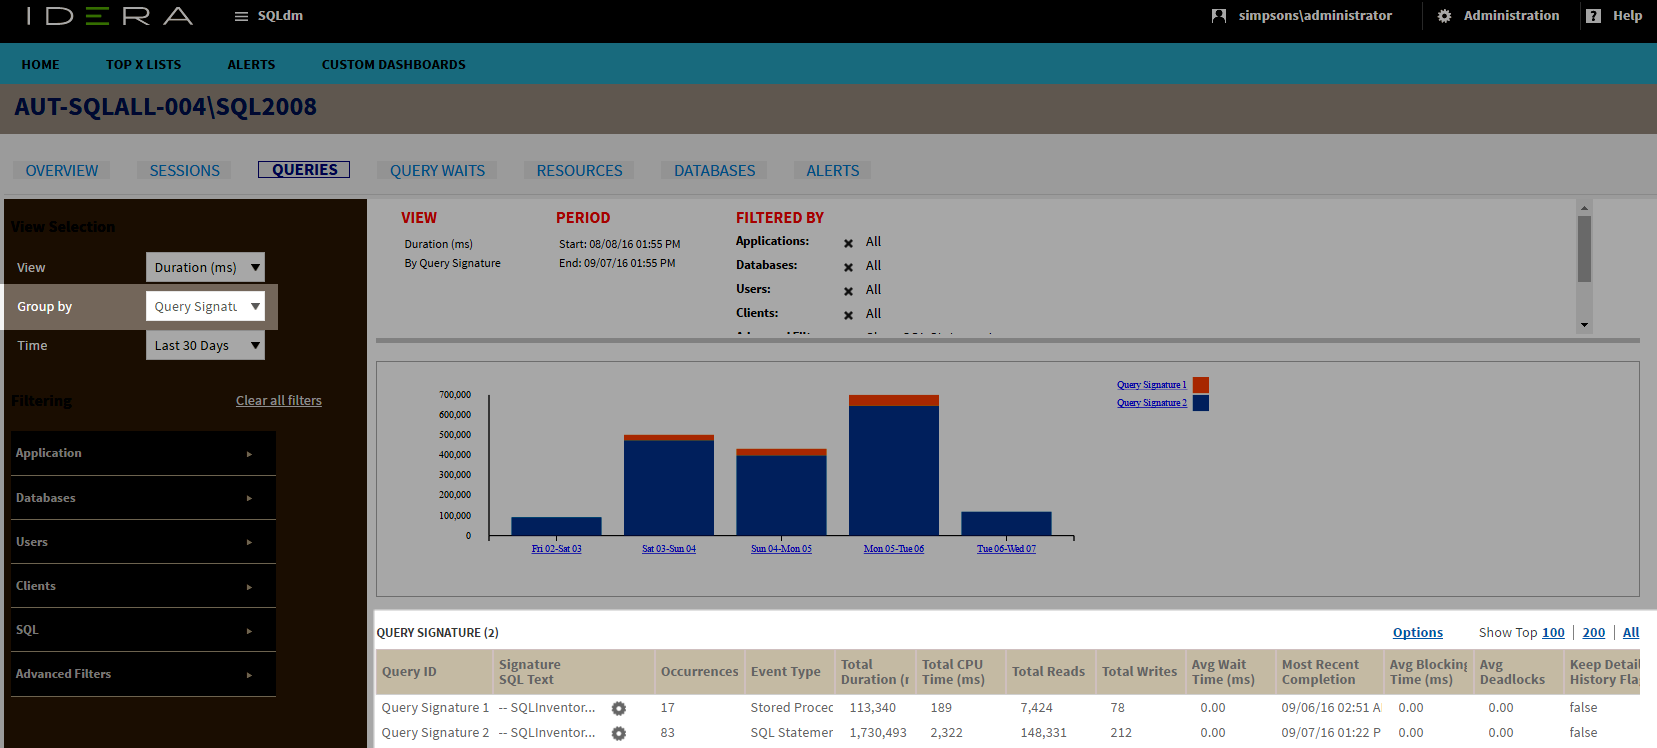
The Query signature list is the data displayed after you selected Group By Query Signature in the View Selection of the Main Query view. The Query signature list provides you with the following information by default:
- Query ID
- Signature SQL Text
- Occurrences
- Event Type
- Total Duration (ms)
- Total CPU Time (ms)
- Total Reads
- Total Writes
- Average Wait Time (ms)
- Most Recent Completion
- Average Blocking Time (ms)
- Average Deadlocks
- Keep Detailed History Flag
- Aggregated
Additional columns are available through the Column Chooser under Options.
- Database
- Average Writes
- Total Blocking Time (ms)
- Average Duration (ms)
- Average CPU Time (ms)
- Reads as % of list
- Total Wait Time (ms)
- Average I/O Per Second
- Total Deadlocks
- CPU as % of list
- Average Reads
- Average CPU Per Second
- Application
To research for additional query details, you can perform the following actions from this list:
Records
You can display the top 100, 200, or all records by clicking the different Show Top options.