The Monyog Object model (MOM) abstracts all OS/MySQL values required for calculating all performance metric. It relieves the user from performing low level tasks like connecting to the servers, executing SQL statement, checking return codes, etc.
Values from MOM are used to calculate and display metric, check thresholds, send notification mails, etc.
All output returned from the "SHOW GLOBAL STATUS" is available as MONyog.MySQL.GlobalStatus.*. For example: to get the value of Uptime status variable, you can use MySQL.GlobalStatus.Uptime.
Similarly the following Object Models are defined as follows:
Variable | MOM Object |
|
|
|
|
|
|
OS-level counters |
|
MOM variable for SQL DM for MySQL tags and server names
AlertCondition:
This attribute expects an expression that should evaluate to one the following 3 values: Critical, Warning, or None. Generally, a JS expression or function is specified which compares some of the MOM values to the Warning or Critical threshold values defined above. (Optional) Consider two examples of a monitor to receive alerts based on an alert condition.
function()
{
    if(ToInt(MONyog.MySQL.GlobalStatus.Select_scan) > 1000)
        return GetWarnStatusInt(this.Value, this.Critical, this.Warning, true);
    else
        return "None";
}
function()
{
    if(this.Value != "(n/a)" && this.Value > 1)
        return "Critical";
    else
        return "None";
}
WarmUpRequired: A value of Yes specifies that this metric makes sense only if the server is running for a minimum period of time. If the server is not running for the minimum period, AlertCondition is not evaluated and no alerts would be displayed or notified. The default value is 3 hours, if you want to change this value; go to Settings, select General you find MYSQL WARMUP PERIOD.
MailAlert: Specifies whether the user wants mail alerts for this metric in case the thresholds are crossed. (Optional)
Graph: This value defines whether real-time graphs are shown for this metric. (Optional)
Bargraph: This value defines whether Percentage type value should be plotted as Bar Graph. (Optional)
Uptime: This value determines whether this metric contain cumulative values. Cumulative values are those values which always increase continuously since server startup (or since last FLUSH STATUS). For example: Connection Attempts. The value of Connection Attempts is always incremented by the MySQL server. Cumulative values are treated differently from "point in time" values like "Currently Running Threads".
If a metric is Cumulative you should always set the value of this attribute to a constant expression: "MONyog.MySQL.GlobalStatus.Uptime"
Format: The display format of various counters. The only possible value currently applicable is - NumCounterWithSeconds. This specifies whether the metric values should also be displayed in "per second" value.
AdviceText: The advice text that is shown to a user whenever any AlertCondition evaluates to "Critical" or "Warning". This text is also shown as the tool tip when the user points the mouse over the alert icons.
RetryOverride: A MOM variable that takes an integer value and overrides the server-level "Send notification when alert-able" setting at the counter-level. Note: It does not take the value "0".
NotifyStableOverride: A MOM variable that takes either "Yes" or "No" as a value and overrides the server-level "Notify when stable" setting at the counter-level.
MOM variables for SQL DM for MySQL tags and server names
Tags and server names that are used in SQL DM for MySQL are exposed as Monyog Object Model (MOM) variables. MONyog.Connections.TagName returns an array of tags for that server.
MONyog.Connections.ConnectionName Gives the name of that server. This can be extremely useful while setting different threshold levels (based on tags or server names) for a monitor. For example:
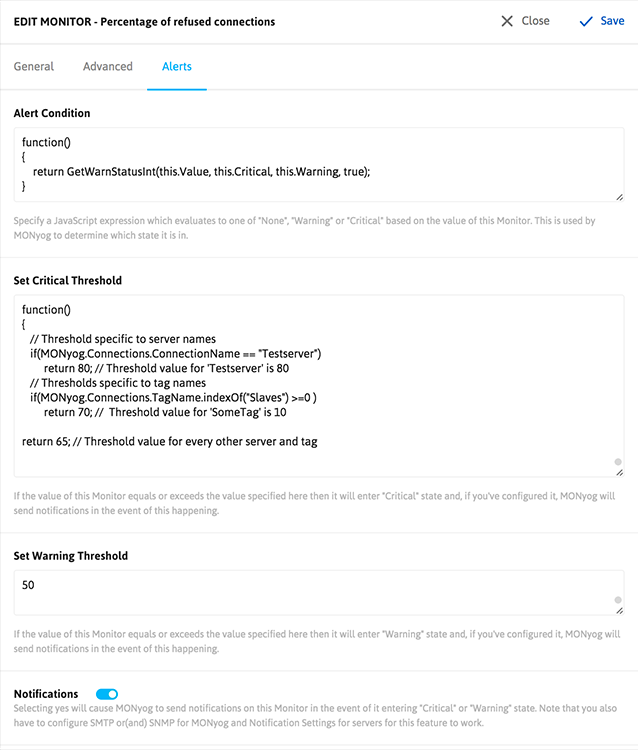
The following can be added to the critical/warning field in Add/Edit server->View Advanced to set server and tag specific thresholds.
// Threshold based on server names
if(MONyog.Connections.ConnectionName == "Testserver")
   return 80; // Threshold value for 'Testserver' is 80
if(MONyog.Connections.ConnectionName == "Productionserver")
   return 50;
// Thresholds based on tag names
if(MONyog.Connections.TagName.indexOf("SomeTag") >=0 )
   return 10; //  Threshold value for 'SomeTag' is 10
if(MONyog.Connections.TagName.indexOf("SomeOtherTag") >=0 )
   return 39;
Example of a Monitor(Percentage of max allowed reached) that is customized to receive alerts based on server names and tags.
SQL DM for MySQL Attribute Reference - Charts Interface
- Chart Name: The name of the new Chart.
- ChartType: The type of chart can be MySQL or System.
- SeriesCaption: Array containing labels for every series in a graph.
- SeriesValues: Array containing the values of each series in a graph.
- ChartValue: The type to plot the actual values of the seconds_behind_master where it is the difference between the 2 intervals. It can plot the values in 2 ways:
- Delta
- Current
- This chart shows boolean values: Possible values are "OnOff" only. This is a special time of Y-Axis plotting that has only 2 possible values - "On" or "Off". This type of graph is useful for plotting Availability status of MySQL/OS across a timeframe. (Optional)
- Unit: Specify y-axis unit in the chart. Ex: ['','KB','MB','GB','TB']
- Unit Factor: The limit when the unit should be incremented. Ex: if this value is 1024 then, 1024 = 1KB, 1024KB=1MB and so on.
- Uptime: See the section for "SQL DM for MySQL Attribute Reference - Monitors Interface". (Optional)
System Information Populated by MOM
The System Information is populated by MOM is divided into the following categories:
General
MONyog.System.General.version: The Linux kernel version.
Physical Memory (in Kilobytes)
MONyog.System.Mem.sys_mem_total: Total physical memory.MONyog.System.Mem.sys_mem_free: Available physical memory.MONyog.System.Mem.proc_mem_vmrss: Physical memory being used by MySQL.
Swap memory (in Kilobytes)
MONyog.System.Swp.sys_swp_total: Total swap memory.MONyog.System.Swp.sys_swp_free: Free Swap memory.MONyog.System.Swp.proc_swp_vmsize: Swap memory being used by MySQL.
CPU
Below are the CPU related metrics. Each gives the number of jiffies spent in various modes, since the last capture.
MONyog.System.Cpu.sys_cpu_user: User modeMONyog.System.Cpu.sys_cpu_nice: Nice modeMONyog.Systeem.Cpu.sys_cpu_system: System/Kernel modeMONyog.System.Cpu.sys_cpu_idle: Spent IdlyMONyog.System.Cpu.sys_cpu_iowait: Spent in waiting for IOMONyog.System.Cpu.sys_cpu_hi: Spent in hardware interruptsMONyog.System.Cpu.sys_cpu_si: Spent in Software interrupts
I/O
Below are the block devices related metrics. Each gives the number of blocks read and written to the devices attach to the system.
MONyog.System.Io.blocks_in: Total number of blocks read from the devices.MONyog.System.Io.blocks_out: Total number of blocks written to the devices.
Custom
MONyog.System.Custom.Available: If the system is available to Monyog or not.
Disk
MONyog.System.Disk.sys_disk_free_mysql: Amount of free space left on the volume where MySQL data resides.MONyog.System.Disk.sys_disk_freepercent_mysql:Percentage of free space left.MONyog.System.Disk.sys_disk_total_mysql: Total size of the volume where MySQL data resides.MONyog.System.Disk.sys_disk_used_mysql: Space being used by various files on the volume.MONyog.System.Disk.sys_disk_free_innodb: Amount of free space left on the volume where InnoDB data resides.MONyog.System.Disk.sys_disk_freepercent_innodb: Percentage of free space left.MONyog.System.Disk.sys_disk_total_innodb: Total size of the volume where InnoDB data resides.MONyog.System.Disk.sys_disk_used_innodb: Space being used by various files on the volume.
Connection:
Connection name, MySQL user, SSH user, SSH tunneling user which are saved in connection details are exposed for customization in Monitors. (For instance 'connection name' can be accessed using MONyog.Connections.ConnectionName, 'MySQL user' as-MONyog.connections.MySQLUser etc.)
MONyog.connections.ConnectionName: Name of that serverMONyog.connections.TagName: Returns an array of tags for that serverMONyog.connections.MySQLUser: Using this MySQL user can be accessedMONyog.connections.MySQLHost: MySQL host can be accessedMONyog.connections.MySQLPort: MySQL port can be accessed
MONyog.connections.SSHHostSystem: To access SSH hostMONyog.connections.SSHPortSystem: To access SSH portMONyog.connections.SSHUserNameSystem: To access SSH username
MONyog.connections.SSHHostTunnel: To access SSH hostMONyog.connections.SSHUserNameTunnel: To access SSH usernameMONyog.connections.SSHPortTunnel: To access SSH port
MySQL Information Populated by MOM:
MySQL Error log
MONyog.MySQL.ErrorLog.Is_accessible: To access the MySQL error logMONyog.MySQL.ErrorLog.Total_size: Size of MySQL error logMONyog.MySQL.ErrorLog.Size_changed: To determine any new entry is there or not in MySQL error logMONyog.MySQL.ErrorLog.Last_error: Last error in the MySQL error log
Innodb Deadlock
MONyog.MySQL.InnodbStatus.Deadlock_detected: Any new Innodb deadlock is foundMONyog.MySQL.InnodbStatus.Last_detected_time: Period in which last deadlock is detectedMONyog.MySQL.InnodbStatus.Latest_deadlock: Latest deadlock is detected