RDS/Aurora OS monitoring feature introduced with Monyog-8.1.0. SQL DM for MySQL makes use of the CloudWatch API and uses the different OS metrics available with the API to fetch and display the data. All the RDS/Aurora OS monitors are shown under the monitor group "RDS/Aurora Instance Metrics" in Monitors page and the corresponding charts are available on the Dashboard page. In order to be able to see the OS data, you should first enable system metric for the RDS/Aurora instance
Enabling System Metrics
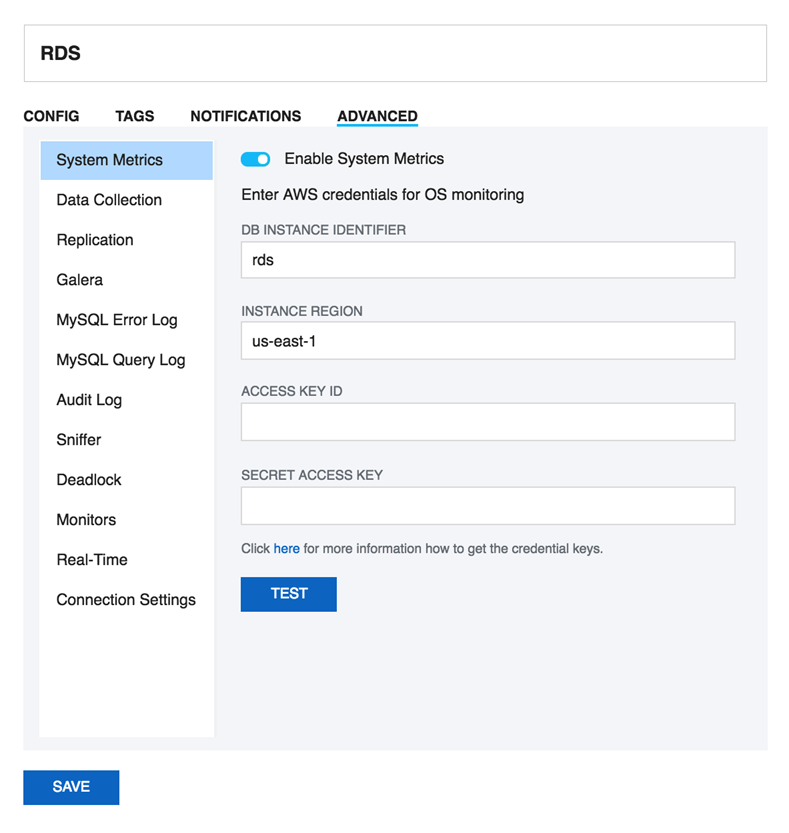
Go to Servers, select Edit server, and choose Advanced of the RDS/Aurora instance and Enable System Metrics. Once enabled, the user should enter the following four parameters:
- DB instance identifier: A unique name to identify your RDS/Aurora instance.
- Instance region: The region in which your instance is hosted, for e.g: us-east-1
- Access key ID: It is a twenty character long key ID which can be created from the AWS Management Console. It is used to make a programmatic request to AWS.
- Secret access key: It is a forty characters long and can be created from the AWS Management Console. You can refer to the documentation, on how to generate credential keys in the following page: Getting your Access Key ID and Secret Access Key.
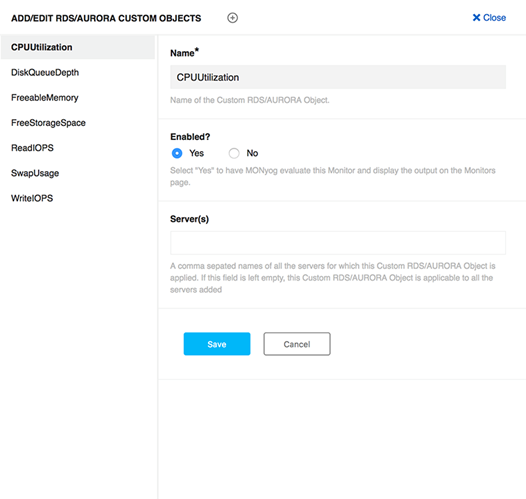
Enabling RDS/Aurora Custom Objects
Once the System metrics is enabled, you start getting OS data in the monitor group RDS/Aurora Instance Metrics. The custom objects CPU Utilization, Freeable memory, Read IOPS, and Write IOPS are enabled by default, while rest are disabled. In order to enable the others:
Go to Monitors, select RDS/Aurora Instance Metrics, click the![]() icon, select Manage RDS/Aurora Custom Objects, and select Yes for the Enabled option for any of the listed custom objects.
icon, select Manage RDS/Aurora Custom Objects, and select Yes for the Enabled option for any of the listed custom objects.
Adding New RDS/Aurora Custom Objects
Apart from the default metrics shipped with SQL DM for MySQL, any user can also add an RDS/Aurora Custom Object from the list of available CloudWatch metrics (Refer here for the CloudWatch
metrics available for RDS and here for the Aurora instances). Adding RDS/Aurora Custom Objects is a 2-step process:
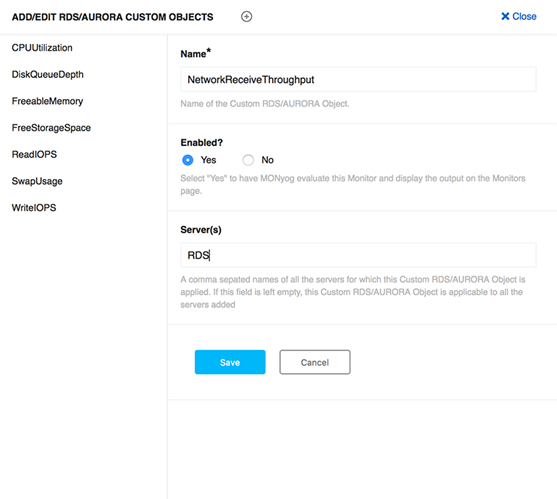
Adding a Custom Object
- Go to Monitors, select RDS/Aurora Instance Metrics, click the
 icon, select Manage RDS/Aurora Objects, and click Add new RDS/Aurora custom object (+) .
 - Enter the name of the CloudWatch Metric which you want to add under the Name field. You can also give the name of the servers comma separated for which you want this metric to be evaluated for.
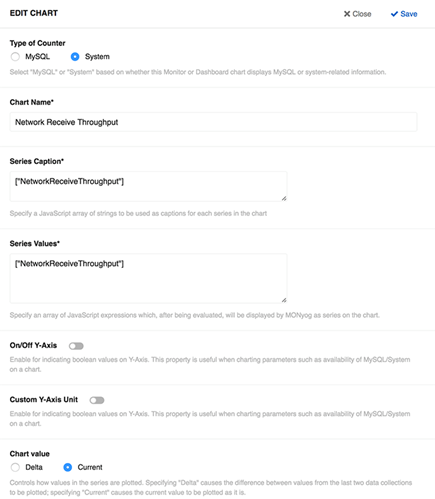
Adding the Monitor
- Go to Monitors, select RDS/Aurora Instance Metrics, click the
 icon, and select Add new monitor.
 - Enter Monitor name and the Monitor group name in which you want to add this new monitor to (use "RDS/Aurora Instance metrics" if you want to add it in this group). Select System as "Type of counter" if you are adding a system metric.
Enter a simple JavaScript function in the Value field using the Cloudwatch metric like:
function()
{
 return GetAWSMetricVal("NetworkReceiveThroughput");
}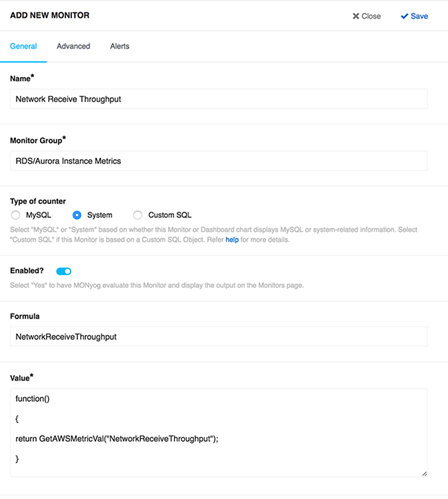
Enabling RDS/Aurora Dashboard charts
Go to Dashboard, select Manage Dashboard, and Enable the listed RDS/Aurora charts under System Charts. The Dashboard page gives the flexibility to create a dashboard with a particular set of charts, so a user can create a dashboard with only RDS OS metrics charts for ease of monitoring.
Adding New RDS/Aurora Dashboard charts
To add a RDS/Aurora chart in the dashboard page, the corresponding RDS/Aurora custom objects should be defined and enabled at Monitors -> RDS/Aurora Instance Metrics -> click the![]() icon -> select Manage RDS/Aurora Objects. Once enabled, follow the steps below to add the chart:
icon -> select Manage RDS/Aurora Objects. Once enabled, follow the steps below to add the chart:
- Go to Dashboard , select Manage Dashboard, and click Add new chart .
- Select System as the "Type of counter" and give a proper chart name.
- Enter the RDS/Aurora custom object in the series caption field and the corresponding MOM (Monyog Object Model) variable in Series values field.