MySQL query log settings
SQL DM for MySQL retrieves (completely or partially) the General query log and the Slow query log from the MySQL servers it connects to, and analyzes them. Here, you see how to set up details for the connection, so that log analysis are available with SQL DM for MySQL. You have to set up details for the general query log and the slow query log independently. Enabling slow query log 'log queries not using indexes' instead needs SUPER privilege. Refer to the MySQL Documentation on how to enable and configure logging. MySQL server logs can be written to files on the server machine or to tables in the MySQL database itself.
The MySQL server (since version 5.0) has an option to log (in the slow log) queries that do not use an index. Such queries need not be slow if there are only a few hundred or few thousand records in the table(s) involved. But they are 'potentially slow' and should be identified if they access tables, which continue to grow. You can enable and disable it, as well (SQL DM for MySQL sends the appropriate SET of statements to MySQL).
Logs written to files
First, consider the situation where server logs are stored as files on the server machine. This is the most common situation and the only one available with MySQL servers before version 5.1.
If it is the first time you configure a server with this option, click the Fetch query log details button. MySQL server detects (it is stored in server variables) what logs are enabled and how logging is configured. Click Test Path to verify the path. SQL DM for MySQL connects and verify the existence of the file (but not its content).
The log files can be accessed from the local file system (if SQL DM for MySQL and MySQL is running on the same computer) or by using SFTP (if SQL DM for MySQL and MySQL is running on different computers). Note that you must use the file and path syntax of the machine where the logs are.
If the log files can be accessed from a shared drive, over a network, or from a network enabled file system (like NFS on Linux), then SQL DM for MySQL can access them as if they were local files. No additional SSH/SFTP configuration is required in this case: the operating system takes care of the file transfer transparently.
When Via SFTP option is chosen, then SSH server details as defined in SSH server details settings are used to read the file from the remote system.
If MySQL server version is greater than 5.1.6 then all the fields mentioned in log analyzer would be editable i.e. if a user changes and saves the settings by clicking Save a pop up is displayed where a user can set the new value to corresponding MySQL Server.
By default, MONyog(SQL DM for MySQL) service runs under Local System Account. If you have Slow query or General query logs in a Mapped Network Drive, SQL DM for MySQL is not able to reach it. You need to use UNC notation for SQL DM for MySQL to be able to access them. See FAQ 31 for details.
Logs written to MySQL tables
It is supported by MySQL from version 5.1. Also, SQL DM for MySQL supports when this option is available. Here, click the Fetch Log Details From MySQL button. When this option is used there is no file path to configure and no SSH details to consider. SQL DM for MySQL can retrieve the server log by sending simple SELECT statements. Only the MySQL user used by SQL DM for MySQL to connect to MySQL must have SELECT privileges to the tables.
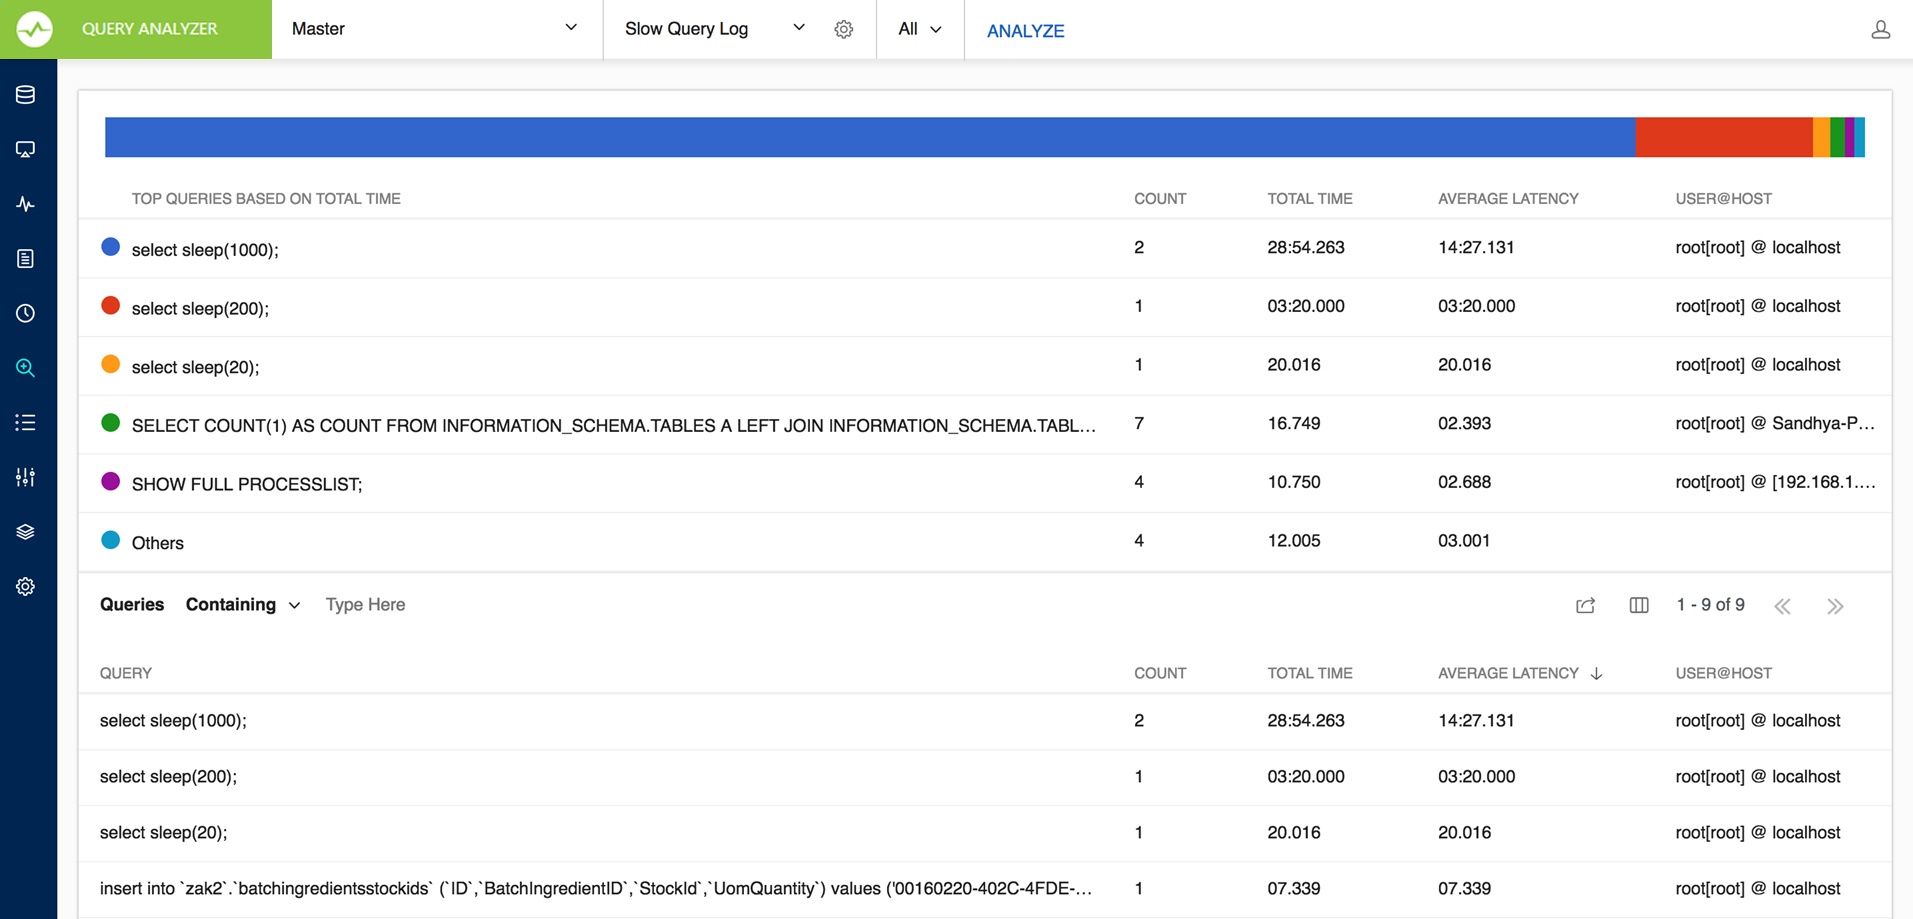
In the Query Analyzer tab select which of the MySQL servers and the type of log (including the 'pseudo log') you want to analyze. Next, click Analyze to start the analysis, and after a while it displays an analysis result like, for Slow Query Log:
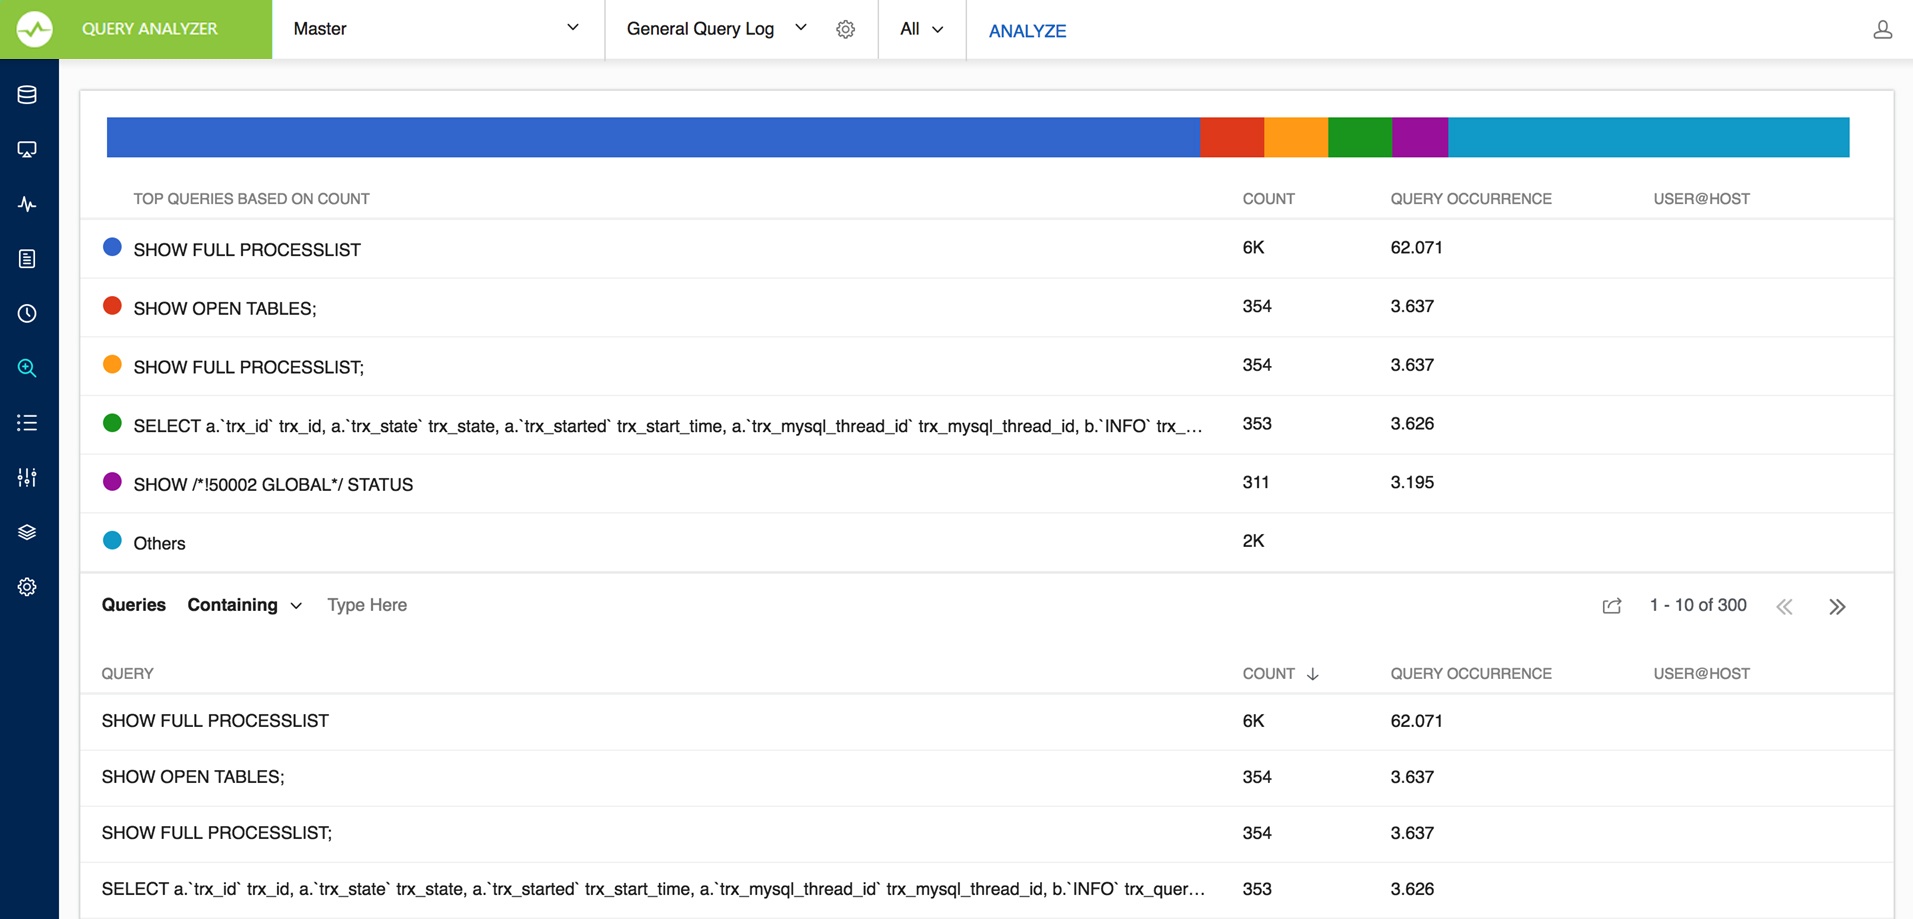
For General Query log,
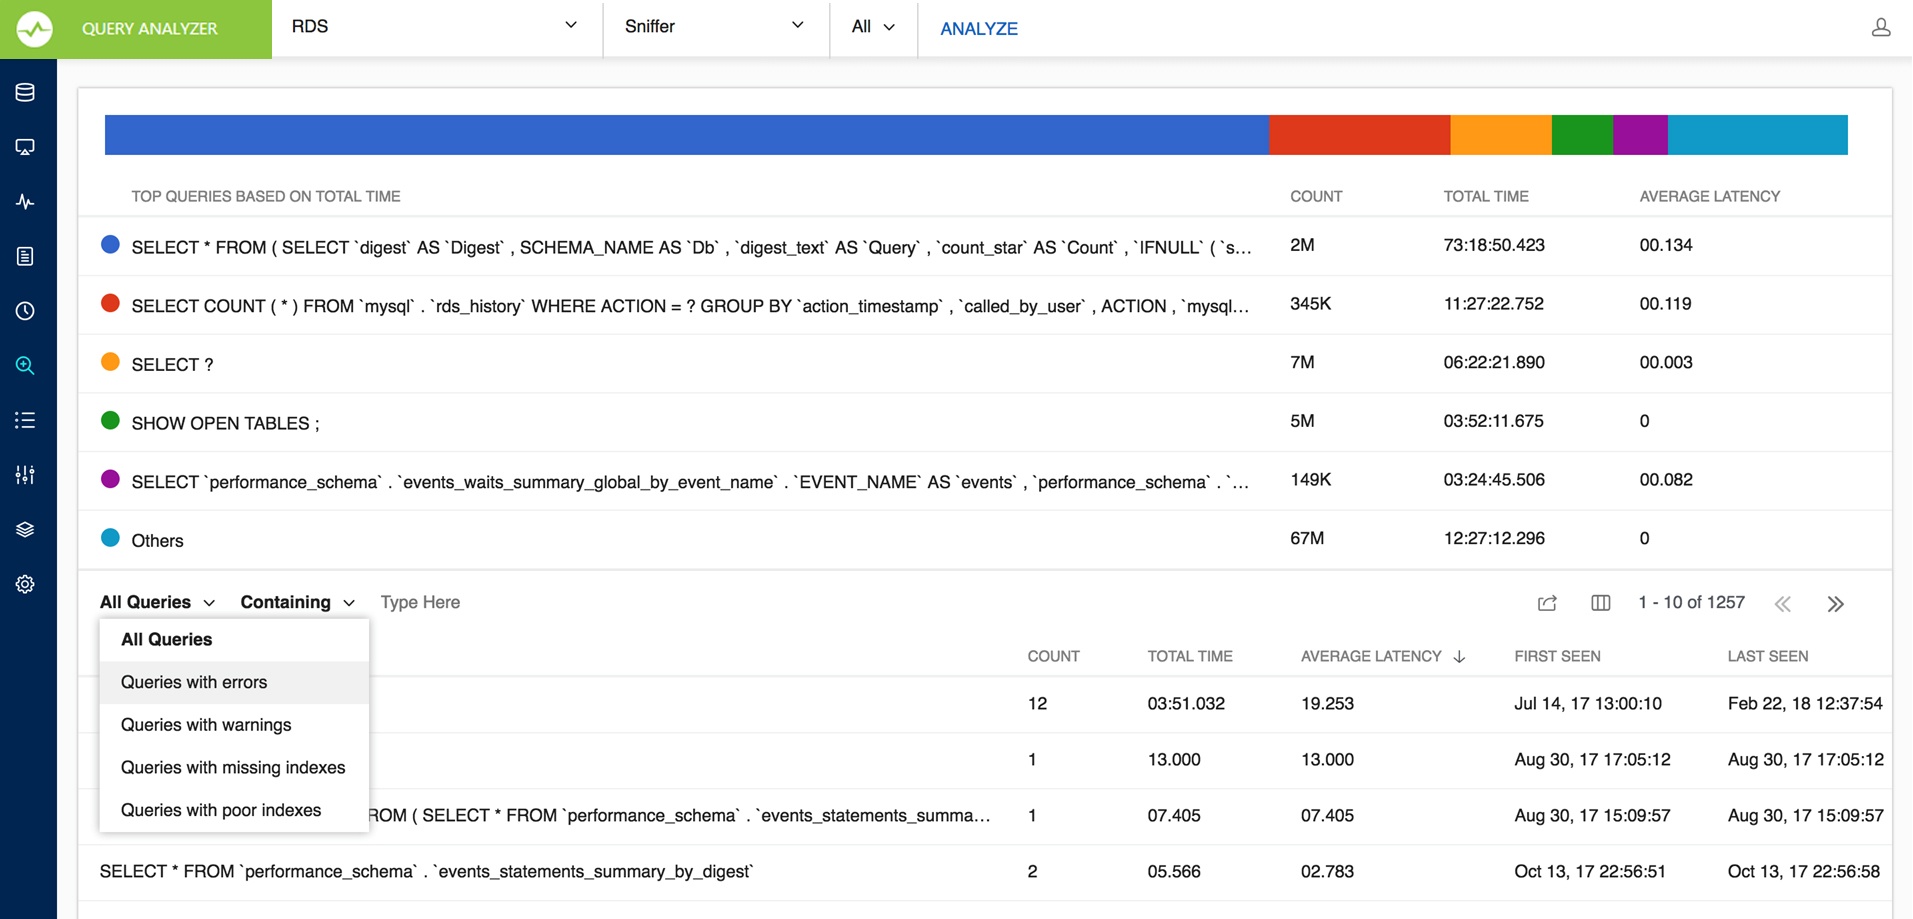
For Sniffer
SQL DM for MySQL Query Sniffer is a functionality that records a pseudo server log and stores it in the SQL DM for MySQL embedded database. With Query sniffer enabled, SQL DM for MySQL can populate the pseudo server log in three different ways at the intervals you specify:
- By utilizing Performance Schema tables (
events_statements_summary_by_digest,events_statements_history_long) and collecting snapshots at regular intervals. - By sending the query
SHOW FULL PROCESSLISTto the MySQL server. - Or, by connecting to a running instance of the MySQL-Proxy program that is used by one or more clients to connect to a MySQL server.
Performance Schema on MySQL contains queries executed on server along with other information:
- Number of rows sent and examined
- Number of temporary tables created on disk
- Number of temporary tables created on memory
- Number of joins performed and the type of join
- Whether sorting happened and the type of sort
- Whether index used
- Whether good index used
SQL DM for MySQL uses performance schema statement digest table(events_statements_summary_by_digest) to get the above information and is dependent on the statements_digest in setup_consumers table. By default, this is enabled. If not, it can be enabled by executing the following:
UPDATE performance_schema.setup_consumers
SET enabled = 'YES'
WHERE name = 'statements_digest';
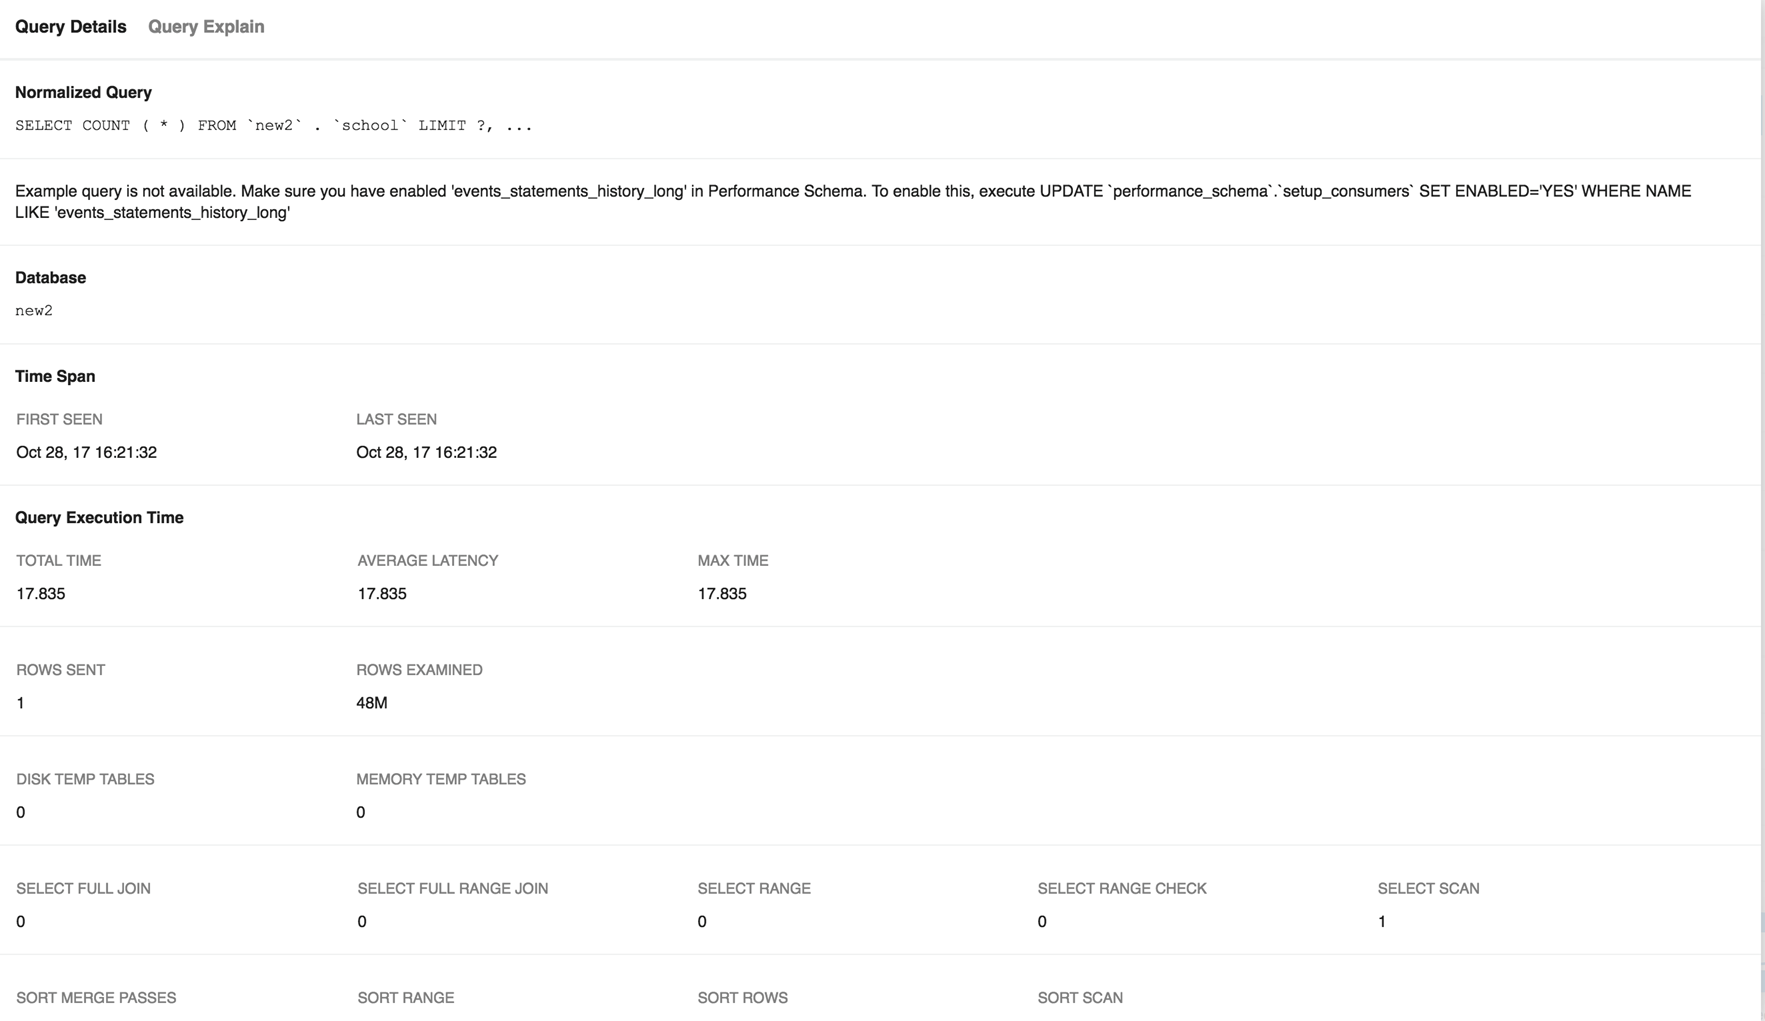
Example query is available in events_statements_history_long table and has to be enabled and is dependent on the events_statements_history_long in setup_consumers table. By default, this is not enabled and should be enabled by executing
UPDATE performance_schema.setup_consumers
SET enabled = 'YES'
WHERE name = 'events_statements_history_long';
The performance_schema.events_statements_summary_by_digest table size is dependent on performance_schema_digests_size
global variable. By default, this size is set to 5000 rows. Once it reaches this limit you may lose the queries. SQL DM for MySQL provides an option to truncate the performance schema digest table when it reaches 80% of performance_schema_digests_size.
Performance schema based sniffer comes with different filters like: Queries with errors, Queries with warnings, Queries with missing indexes, and Queries with poor indexes.
performance_schema truncates queries after 1024 characters and always replaces literals with a wildcard (in other words: P_S contains a summary/an aggregation only). So query listing not replacing literals is not possible with this option. And finally also observe that no other tool (or user) should be writing (including deleting or truncating) to events_statements_summary_by_digest and events_statements_history_long tables if this option is used as there is only one of each table for all users (it is not a temporary table or a materialized view or similar private for the user). This is a design limitation with the tables in P_S as such and not a Monyog issue.
If using MySQL version less than 5.6.14 then only Proxy or Processlist can be used in SQL DM for MySQL. Although, configuring a Proxy instance is a little more complicated, the PROXY-based sniffer has several advantages over the PROCESSLIST-based, including the following:
- All queries that was handled by the Proxy are recorded by SQL DM for MySQL sniffer when PROXY option is used. When PROCESSLIST option is used very fast queries may execute completely between two SHOW FULL PROCESSLIST queries andis not recorded.
- You can choose to analyze queries from specific client(s)/application(s) only. Simply let (only) the clients that you want to focus on at the moment connect through the Proxy.
- When using the PROXY option you can distribute part of the load generated by the sniffer on the machine that fits best in your deployment scenario (like on the one that has most free resources available) by deciding where to have the PROXY: The MySQL machine, the SQL DM for MySQL machine (if not the same), or quite another machine. The machine running MySQL have no additional load due to the sniffer if the Proxy is not running on that machine.
Also, if more SQL DM for MySQL instances use the same PROXY they use the same data collected, when the Proxy Sniffing is enabled by the first SQL DM for MySQL instance. To work with SQL DM for MySQL sniffer the MySQL Proxy instance must be started with the name of a LUA script called MONyog.LUA (LUA is a scripting/programming language) as argument and is distributed with SQL DM for MySQL. You find it in the Monyog program folder after installing (Windows and Linux RPM) or unpacking (Linux .tar.gz) the SQL DM for MySQL program package as downloaded from the IDERA website. The MySQL Proxy program however you need to download from MySQL website (we cannot include it for license reasons). SQL DM for MySQL works with Proxy versions from 0.61 to 0.81(latest currently) with the exception of 0.7x versions for windows and Mac due to a bug in those specific builds. For more information on Proxy MySQL Proxy.
To start a Proxy instance for use with SQL DM for MySQL use the command:
- For Older version:
Proxy installation folder>mysql-proxy --proxy-backend-addresses=192.168.x.x:3305 --proxy-address=192.168.y.y:4045 --proxy-lua-script=SQL DM for MySQL.lua
- For v0.81 and later:
Proxy installation folder>mysql-proxy --proxy-backend-addresses=192.168.x.x:3305 --proxy-address=192.168.y.y:4045 --admin-username=root --admin-password=root --admin-lua-script=MONyog.lua --proxy-lua-script=MONyog.lua
(It is assumed that the 'MONyog.LUA' was copied to the folder where the PROXY binary is). Also, if no port is specified the PROXY it listens on port 4040. Now, you can connect to the Proxy from one or more clients/applications. The Proxy sends queries to MySQL and results back to the client. But when started with the LUA script for SQL DM for MySQL sniffer it also send information to SQL DM for MySQL that SQL DM for MySQL uses to populate the sniffer 'pseudo log'.
Once this 'pseudo log' has been recorded (in either of the two ways described: PROCESSLIST or PROXY-based) the SQL DM for MySQL log analysis functionalities can operate on the 'pseudo log' as well as the 'real logs'. The data recorded in the pseudo log is purged automatically based on the 'data retention timeframe' option set by you.
Further some filtering options are provided. This filtering happens before storing to the SQL DM for MySQL database. It prevents the sniffer database to grow out of control.The filtering options are as follows:
- User and host: You can choose to store queries executed only by a specific combination of users and/or hosts.
- Minimum time taken: For every PROCESSLIST returned to SQL DM for MySQL, the queries are recorded in the embedded database only if they have been executing for a time greater than the specified minimum execution time. Furthermore, if a query with the same structure and details (like process ID) as one already recorded is encountered, the embedded database is UPDATED, and the statement is recorded only once. This setting should be somewhat larger than the sample interval (and also consider the latency of the connection).
- Queries starting with: Enter any string and only queries starting with that string is recorded. Examples:
SELECT *,UPDATE Customer_Base.
Also note that in PROCESSLIST Sniffer we have an option 'Long Running Query Options' where you can monitor the long running queries by notifying or killing a query which takes more than a time specified by you. You can also specify users whose queries are ignored (i.e. queries by such user are not killed by SQL DM for MySQL and never raise an alert even if they take a longer time to execute than the alert/kill setting time you specified.
Clicking the monitor only locked queries would only monitor those long queries that are locked.
Note that the query sniffer is never a complete General Log. Very fast statements may or may not be recorded as they may or may not finish executing between two PROCESSLIST's generated. The time interval between subsequent data collections for the 'pseudo log' depends on the connection to the MySQL server.
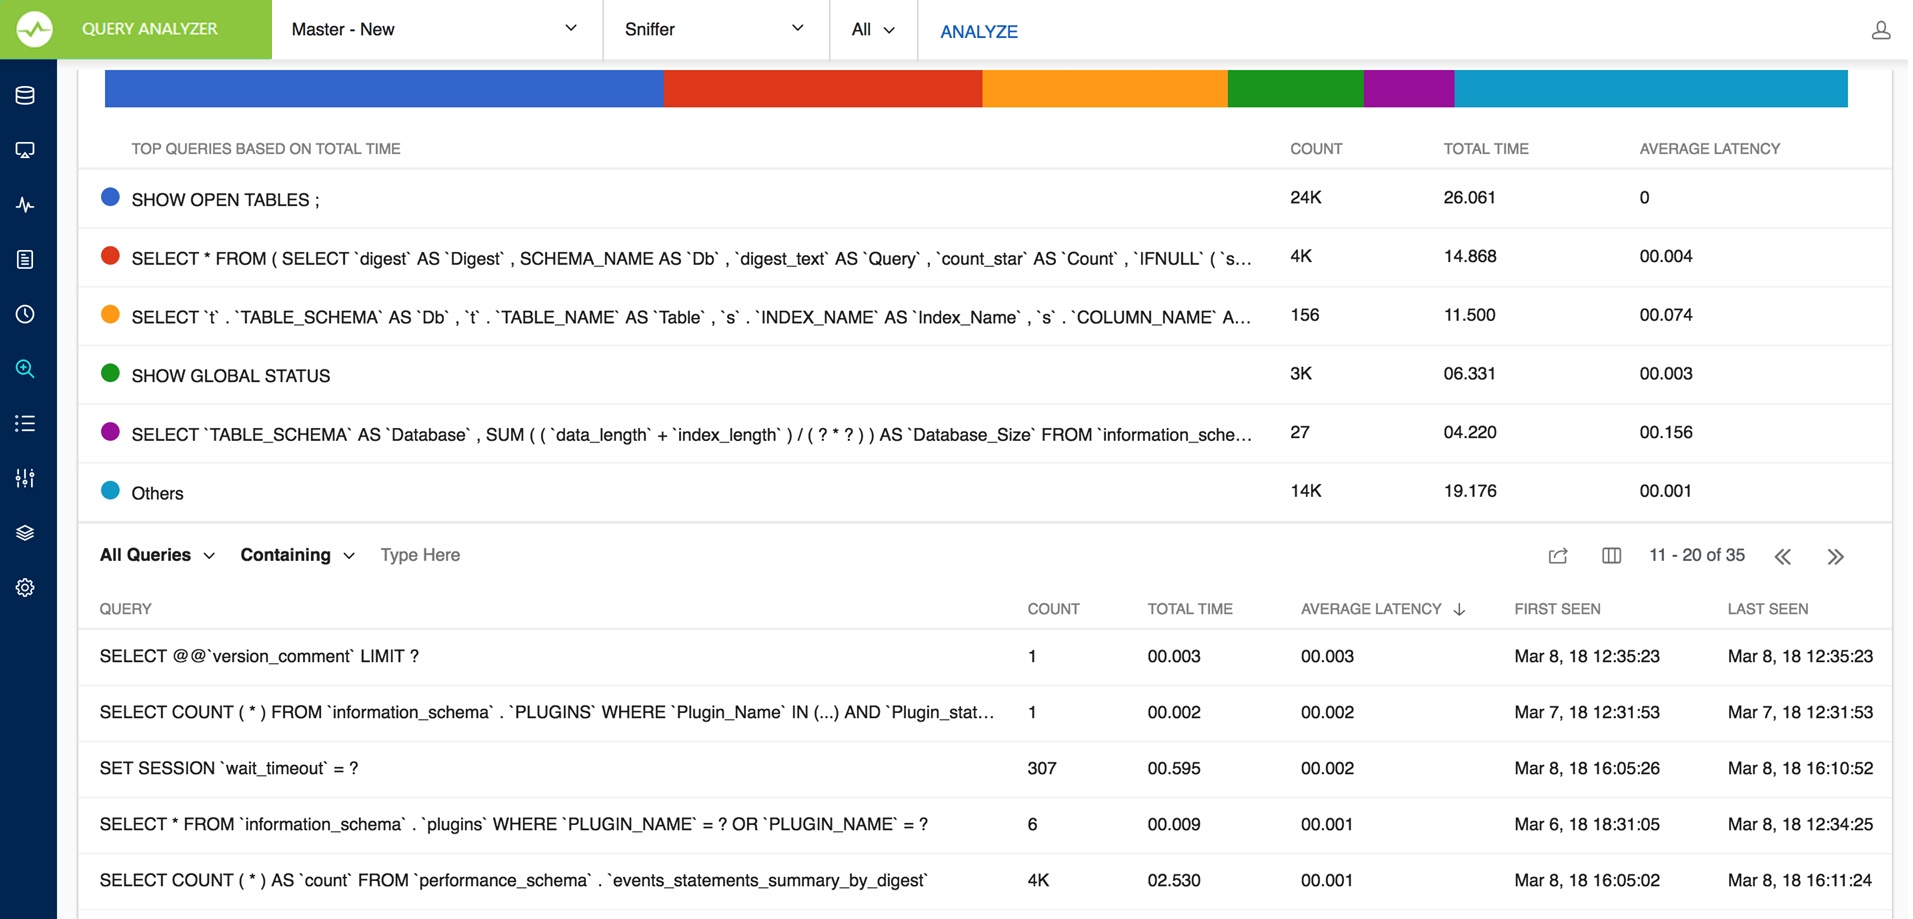
The identical queries are only listed once and the Count column tells how many times this query was executed.
With the General Query Log there are a few specific problems:
- With multi-line queries only record the first line of the statement. The reason is that, as the log does not record the statement DELIMITERs, there really is no way to tell where a multi-line statement ends. Even the option to 'Show full' is not displayed more than one line as SQL DM for MySQL has only stored one line. Refer to FAQ 23.
- It is not always possible to tell what user executed a specific query. When this is the case the User column displays empty in the Query Analyzer output. It is not a bug in SQL DM for MySQL but a limitation with the general log itself.
You can sort the display by clicking on the column header. Note that statement grouping/counting and sorting is case insensitive.
When analyzing the slow server log (but not general log and not sniffer data) you can further click on a query and detailed information displays as follows:
Explain plan is available in Query analyzer for Slow_log table based logging, Processlist based sniffer and performance schema based sniffer.
Filter settings
There is an option to Replace literals from the query. The purpose of this option is to eliminate small differences between almost identical queries. Currently, quoted strings and numbers are replaced with the dummy string '?' only. The filtering settings are stored for that particular session which is not permanent.
For example:
SELECT * FROM customer_master
WHERE cust_id = 23 AND address = 'r;#23 fleet street';
becomes,
SELECT * FROM customer_master
WHERE cust_id = ? AND address = ?;
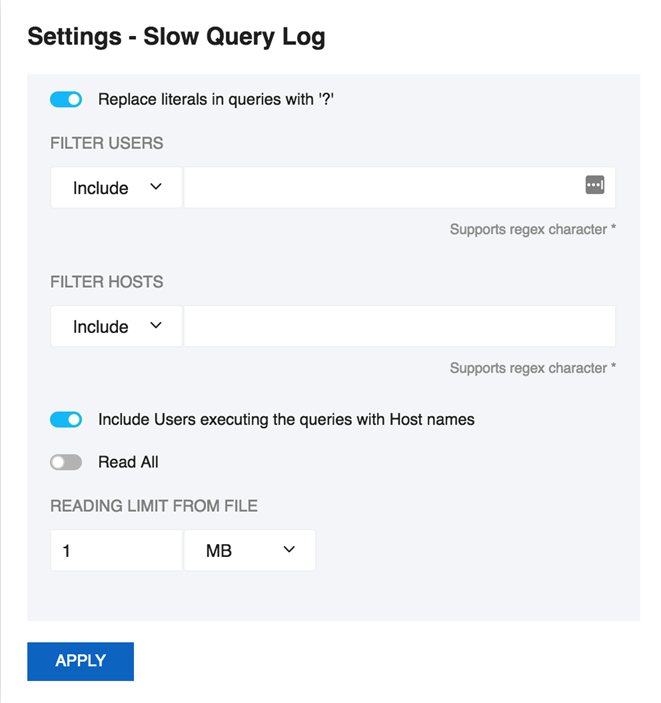
The reading limit All is selected it considers the whole file for analyzing but if the option is Last, it reads the last specified chunk in KB, MB, or bytes out of the whole log file. Also, you can define a timeframe to be analyzed and the size of the 'log chunk' (in KB, MB and Bytes for file based logs and in rows for table-based logs) to be transferred to SQL DM for MySQL.
If All is selected in the list, is not considering any timeframe and just displays all queries within the specified size/chunk. Also note, it is the smallest of those two settings that have effect for the analysis. For analyzing the sniffer pseudo log there is no chunk size to be defined as the complete pseudo log as stored in the SQL DM for MySQL database that is considered. The selected log chunk needs to have statements for the selected period. If not, then SQL DM for MySQL of course only display data from the first log record available.
Include User and Host Information: If this option is selected it displays the User and Host of that particular query and it groups the query analyzer table based on user@host and query.
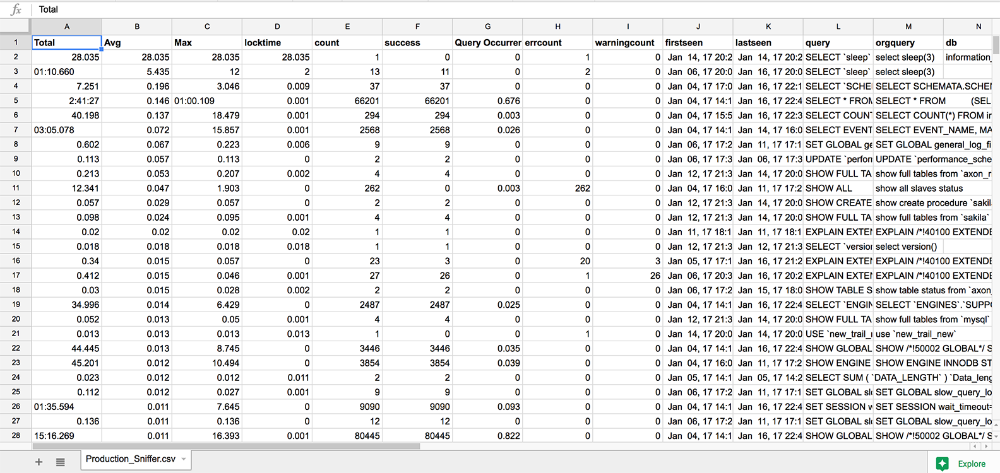
Export As CSV
The option to define the field delimiter is provided because some localized Windows programs for LOCALEs where comma " , " is used as a decimal sign and requires a semicolon " ; " as field separator. This includes Microsoft Office programs (Excel and Access) and Microsoft text-ODBC driver on such localized Windows. On Linux, the situation is more non-uniform but also such localized OpenOffice Calc (spreadsheet) requires semicolon " ; " as field separator.