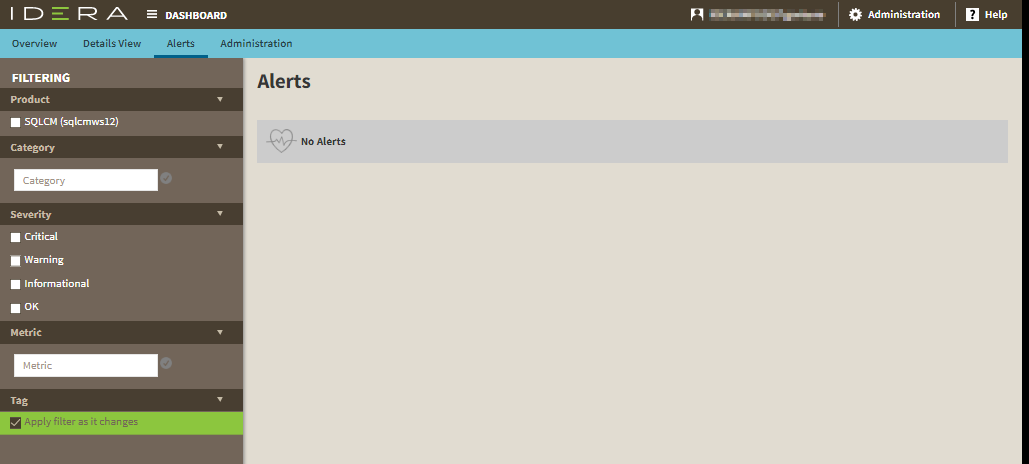
The IDERA Dashboard Alerts view displays any alerts generated by the monitored SQL Server instances in your environment. You can filter by:
- Product. Select one or more of your installed IDERA products to view generated alerts.
- Category. Add category filters to view alerts associated with a specific type.
- Severity. Select one or more severities to view alerts corresponding to those levels. Options include Critical, Warning, Info, and OK.
- Metric. Add metric filters to view alerts associated with a specific metric.
- Tag. Filter alerts based on your created tags.
IDERA | Products | Purchase | Support | Community | Resources | About Us | Legal