This section includes the following topics:
- About the Activity tab
- How the Activity tab is structured
- About the entities you can examine
- How to perform actions in the Activity tab
- How the Activity tab can help you identify performance problems using the Table view
About the Activity tab
The Activity tab allows you to analyze performance behavior over time. The information displayed in the Activity tab is derived from historical data and enables you to access information for different time intervals at varying levels of detail. You can analyze what happened at a specific time, pinpoint problematic time periods, and drill down to analyze a bottleneck that caused a performance problem.
The Activity tab was designed to answer questions such as, What happened yesterday, as well as a month ago and a year ago? and What has been the performance level of my applications over time?
Data in the Activity tab is available up to the last 15 minutes (information on the last minute is available in the Current tab). The Activity tab is usually the place to identify and investigate tuning problems.
When working in the Activity tab, you can choose to work on a specific instance or to view information on all your instances.
You usually switch to the Activity tab after focusing on an instance in the Dashboard tab, or by launching Precise for Oracle from another product (Insight or Alerts). In these cases, the product automatically focuses on the relevant instance.
When you do not select a specific instance to view in-context, a summary of the performance information of All Instances in the application is displayed. You can analyze the average behavior of the entire Oracle Tier. You can then identify the instance which consumes the most resources in your system.
If you are working with Oracle Applications, SAP, PeopleSoft, or Siebel and ERP support is installed, the Activity tab displays information on the historical Oracle activity in relation to the ERP application and users, and specific information on executed forms (Oracle Applications) and transactions (SAP).
See Precise Interpoint - how resource consumption of packaged applications is examined.
How the Activity tab is structured
The Activity tab displays information on a selected entity and its associated entities. For example, if the selected entity were a Program, its associated entities would be Statements. The selected entity is always reflected in the Tab heading, which serves as a point of orientation.
The Activity tab can be displayed in two different views—Table view and Tree view. Both views display the same information, unless otherwise specified. The functionality of these views differ.
The initial view show when opening the Activity tab is the Tree view.
When you open the Activity tab from the Dashboard tab, information on the instance selected in the Dashboard is displayed, or on the entire Tier if the All row was selected. When you open the Activity tab from another tab, the settings from your last visit to the Activity tab are retained, such as a drill down to a Session entity. This is similar to clicking the History button and returning to a previous tab.
The highest-level entity you can view information for in the Activity tab is Tier. You can view a particular instance by selecting it from the Instance selector.
You can use the Filter dialog box to filter the Association area so that only the contribution of certain entities is included. See Filtering data.
About the Table view
The Table view is divided into two areas, the Main area and the Association area. Information on the entity you are analyzing is displayed in the Main area. The entities that are associated with the entity displayed in the Main area are displayed in Association area.
About the Main area in the Activity tab
The Main area shows comprehensive information on the selected entity. You can choose from several views to examine the entity from different angles. For example, if you are analyzing an Instance entity, you can focus on the data displayed in the overview, or choose to view scalability data, or availability information in more detail.
About the Association area in the Activity tab
The Association area provides corresponding information on the entities associated with the selected entity (displayed in the Main area). For example, you can associate with the Programs related to the selected instance. The selection you make is reflected in the Association area only; the Main area remains unchanged. For some entities, tabs above the Association area enable you to view additional information. For example, the tabs displayed for a statement entity are: General, In Oracle, Statistics, and Workshop. Clicking a tab displays different table columns with the same type of associated entities.
From the Association area, you can also drill down to another entity by clicking a table row. A drill down affects the entire tab. When you drill down to another entity, the Tab heading displays the new selection, the Main area displays information on the newly selected entity, and the Association area displays the entities associated with the selected entity.
For example, when you want to view information on a specific program, click Programs from the Association control. The Association area changes to display session-related information. The Tab heading and the Main area remain unchanged.
In the Association area, click the row of the program you want to view detailed information for. The Tab heading indicates the newly selected entity; the Main area displays In Oracle information on the program you drilled down to, and the Association area shows information on the statements associated with this program.
You can also launch a different tab altogether. For example, clicking the Tune icon next to a statement will take you to the SQL tab, in context, to allow detailed investigation and tuning of the SQL statement.
About the Tree view
Figure 1 Oracle Activity tab Tree view
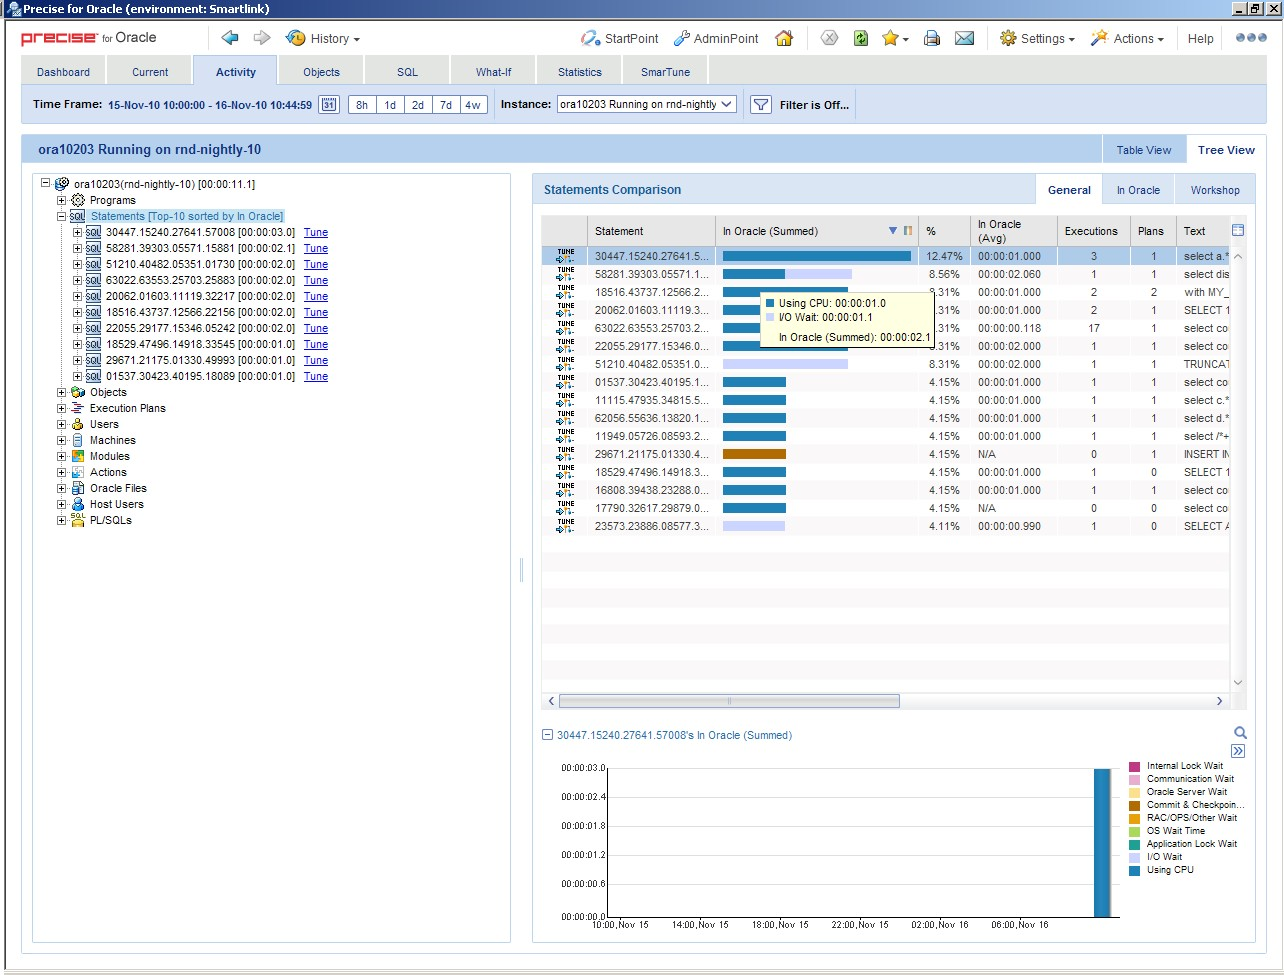
The Tree view displays the same information shown in the Table view, but in a different format that offers different functionality. The Tree view is divided into two areas, the Tree pane and the Details pane. A breakdown of the entities that are associated with the selected entity is displayed in the Tree pane. Information on the entity you selected is displayed in the Details pane.
The order in which the entries in the Tree pane are displayed and which entries are displayed can be changed in the Settings menu.
The duration value displayed next to each entry reflects the duration of each instance in the selected entity, according to the sort parameter you selected. The sort parameter is displayed next to each entity. The default entity for the top entity in the tree is In Oracle time. You change this setting in the Settings dialog box. See About configuring Tree view settings.
The following entities are not displayed in the Tree view: Recent Sessions, Extended Collections and Imported Statements. The Database entity is only displayed when All Instances is selected.
Determining what information is displayed in the Tree
You can control the number of entries displayed and the order in which they are displayed in the tree using the sort and filter option.
To determine what information to display in the tree
- Right-click on an entity in the tree, and then click Sort & Filter.
- In the Associate With dialog box, on the Rows tab, select the entity you want to associate data with from the Populate table with list.
- In the Sort entries by list, determine according to which criteria you want the information to be sorted and in which order.
- From the Display top list, select the number of rows to display.
- On the Criteria tab, do the following for each entity you want to associate data with:
- From the left drop-down list, select an entity.
- From the middle drop-down list, select an operator, such as, Like, <>, Not Like, In, Not In.
- In the text box, type the criteria (case-sensitive) for the selected entity.
If you select the operator Like or Not Like, you can use the % wildcard character. If you select the operator In or Not In, type a comma to separate values.
- Click OK.
About viewing information for entities associated with a selected entity
You can drill down to the entities that are associated with the selected entity by clicking on the plus sign (+) located next to each entity. When you drill down on an entity, the information displayed in the Main area of the Table view is displayed in the Details pane. When you drill down on an instance that is associated with the selected entity, you display the instances that are associated with the selected entity and you can view additional information on the selected instance in the Details pane.
Viewing information from a different time frame
You can switch to a different time frame and view additional information on the selected entity that was collected for that time frame. Only the information in the sub-nodes of the entity you have selected is refreshed.
To select a different time frame
- Click on the entity in the tree.
In the Time Frame list, select a different time frame than the one already being displayed.
Only the information for the selected entity is refreshed, and it is moved up to the top of the tree.
About switching from one view to another
When you switch from one view to another, the information on the selected entity is displayed, in context. For example, if you switch from Table View to Tree View, the entity you selected is highlighted in the tree, and is displayed at the top of the tree, even if according to the sort criteria it should be displayed in another position.
Refreshing a view
The Refresh option refreshes the display from the PMDB.
To refresh the information displayed in a view
- Right-click on an entity in the tree.
- Click Refresh.
Printing the Tree View display
You can print an image of what is displayed in the Tree view.
To print the Tree View display
- Right-click on an entity in the tree.
- Click Print.
- Use the print features of your browser to print out an image of the information displayed in the Tree view.
About viewing additional information on an entry in a table
When information on a selected instance is displayed in table and graph format, in the Details pane, there is a direct correlation between the selected entry in the table and the information displayed in the graph below the table. Selecting a different row changes the information displayed in the graph displayed below the table.
About the entities you can examine
The Activity tab displays information on different entities. This section provides an overview of all entities, their meaning, and their views.
The following entities can be examined in the Activity tab:
- Statements
- PL/SQLs
- Execution Plans
- Objects
- Oracle Files
- Extended Collection
- Sessions (in Table view only)
- Recent sessions (in Table view only)
- Imported Statements
- EMC Storage Devices
- HP Storage Devices
- Entities mentioned in the following section which display the same fields (further called aggregated entities)
About aggregated entities in the Activity tab
In the Activity tab, there are the following available aggregated entities:
- All Instances
- Actions
- Siebel Business Objects
- Databases
- Instances
- Programs
- OA Forms
- SAP Programs
- Users
- Host Users
- Machines
- Modules
- OA Applications
- Siebel Applications
- SAP Functions
- OA Requests
- SAP Screens
- Siebel Views
- J2EE Callers
- J2EE JVM Servers
- Web Transactions
These entities are aggregated entities. They display the aggregated resource consumption of all sessions with the same criteria. For example, User is the aggregation of all sessions executed by the same user; Program is the aggregation of all sessions executed by the same program; Instance is the aggregation of all sessions within an instance. The highest level entity is All Instances. It displays the resource consumption of all the instances in the Tier.
A user may run many programs; a program may be run by many users. To find the resource consumption of a particular user running a particular program, you can either use the Association area in the Table view or navigate to the required context in the Tree view.
All of these entities can be associated with each other and with Statements, PL/SQL, Oracle Files, Objects as well as File Systems, Logical Volumes, and UNIX Devices (only if Precise for Storage, VERITAS version is installed). In addition, all but All Oracle Instances can be associated with Recent Sessions, and Extended Collections.
Database entities can be associated with Instances, Programs, Statements, Execution Plans, Databases, Users, Modules, Actions, Machines, Host Users, PL/SQLs, Oracle Files, Objects, Recent Sessions and Extended Collections.
For these entities, there are the following available views in the Table view:
- Overview
- In Oracle
- Overall Activity
- Scalability
- Availability
- Statistics
- RAC Databases (if a RAC database instance is selected)
In the Tree view, the following entity details are available:
- Highlights (currently only for the J2EE Caller Service entity)
- Over Time
- Overview
When selecting a category under the entity in the Tree view, the following details are available per category:
Table 1 Details per category
| Category | Details |
|---|---|
| Aggregated entities | General, In Oracle, Statistics |
| Statements | General, In Oracle, Workshop |
| Objects | General, In Oracle, I/O Wait |
| Execution Plans | General, In Oracle |
| Oracle Files | General, In Oracle, I/O Wait |
| PL/SQLs | General, In Oracle, Workshop |
About aggregated entities in the Activity tab
Overviews are available for the following entities:
- All Instances
- Actions
- Siebel Business Objects
- Databases
- Instances
- Programs
- OA Forms
- SAP Programs
- Users
- Host Users
- Machines
- Modules
- OA Applications
- Siebel Applications
- SAP Functions
- OA Requests
- SAP Screens
- Siebel Views
- J2EE Callers
- J2EE JVM Servers
- Web Transactions
The Overview displays general information about the selected entity and a table listing the In Oracle sub-states for this entity. See Wait States - In Oracle.
The following table describes what is displayed in the overview.
Table 2 General entity information
| Item | Description |
|---|---|
| Instance Number | Displays the number of the instance in the RAC database. |
| In Oracle (Sum.) | Total time the entity spent In Oracle. |
| Sessions | Total number of active sessions associated with the entity. An active session is one that executed or was executing a statement during the selected time frame and spent some time In Oracle. |
| In Oracle (Avg.) | Total In Oracle time for the entity or number of active sessions associated with the entity. |
| Duration (Avg.) | Average time active sessions associated with the entity were connected to Oracle. |
The following table describes the In Oracle (Sum.) table.
Table 3 In Oracle (Sum.) table
| Column | Description |
|---|---|
| Sub-State | In Oracle sub-state. |
| Bar graph | Graphical representation of the Time column. |
| Time | Amount of time the entity was in this state. |
| % | Percentage of time the entity was in this sub-state. |
Additional information on In Oracle sub-states is available in the stacked bar graph of the In Oracle view and on the In Oracle tab of the table in the Association area.
About In Oracle data view
The In Oracle view displays a stacked bar graph on the In Oracle resource consumption over time, for the selected time frame, broken down into the In Oracle wait states. See Wait States - In Oracle.
About the overall activity view
The Overall Activity view displays a stacked bar graph on the Overall Activity resource consumption over time, for the selected time frame, broken down into the Overall Activity wait states. See Overall activity.
About the scalability view
The Scalability view displays stacked bar graphs that show how the average In Oracle response time varies with the number of sessions or the number of executions. These graphs indicate whether your application scales as the number of sessions or statements executed increases.
The following table explains which graphs are shown for a specific entity.
Table 4 Graphs displayed in the Scalability view
| Entity | Graphs |
|---|---|
| Instance | In Oracle (Avg.) vs. Sessions In Oracle (Avg.) vs. Statement Executions |
| Program, User, Module, Action, Machine, Host User | In Oracle (Avg.) vs. Statement Executions |
About the availability view
The Availability view is only available for the All Instances and Instance entities.
The following table describes the stacked overtime graphs that are displayed in this view.
Table 5 Graphs displayed in the Availability view
| Graph | Description |
|---|---|
| Availability | Compares the overall availability with the Availability SLA, in percent. The settings for the Availability SLA are defined in AdminPoint. For more information, see the Precise Administration Guide. Availability information is also displayed on the Overview tab in the Dashboard tab. |
| Unavailability Times | Indicates the amount of time that the instance or instances were unavailable. |
About the statistics view
The Statistics view displays a table that indicates a change in Oracle statistics for the selected entity during the specified time frame. The Statistics column displays statistics that represent different counters with different units. For more information, see the Oracle documentation and Oracle statistics usage within Precise for Oracle.
About the RAC database view
The RAC Database view compares activity of the selected instance to the activity of the all the instances in the entire RAC database. The RAC Database view is only available for RAC Database instances. The following table describes the information displayed in the RAC Database view.
Table 6 RAC Database view
| Item | Description |
|---|---|
| Database | Displays the logical name of the RAC database. |
| DB Name | Displays the Oracle database ID for the instance. |
| DB ID | Displays the Oracle database ID. |
| In Oracle (Sum.) | Total time the instance spent In Oracle. |
| Sessions | Total number of active sessions associated with the instance. An active session is one that executed or was executing a statement during the selected time frame and spent some time In Oracle. |
| Executions Counts | Number of executions. |
| In Oracle (Avg.) | Average In Oracle time for all instances in the RAC database. |
| Instances | Displays the number of instances that share the same RAC database with the selected instance. |
| In Oracle (Avg. per instance) | Average In Oracle time for the selected instance. |
| RAC Database table | Shows additional details on the instances in the RAC database, such as the number of sessions run by each instance, the amount of time each spent actively executing statements and PL/SQLs within Oracle, and the number of statements executed by each instance. |
About Statement and PL/SQL entities
Statements and PL/SQL are the fundamental building blocks of an application. Application tuning will nearly always involve looking at the performance of the SQL. These entities share a common set of views in the Main area of the Activity tab.
To tune a statement, you can launch the SQL tab by clicking the SQL tab button for a statement in the Main area or the Tune icon for a statement in the Association area.
You can drill down from a PL/SQL procedure to the SQL statements that it contains or from a statement to the PL/SQL procedure that it contains. You can also associate statements and PL/SQL with the following entities: Instances, Programs, Users, Modules, Actions, Machines (or their ERP equivalents), Host Users, Oracle Files, Objects, as well as File Systems, Logical Volumes, and UNIX devices (only if Precise for Storage, VERITAS version is installed).
You can also save a statement. See Editing the properties of a statement.
The following views are available for a statement and PL/SQL entity:
- Overview
- In Oracle
- Overall Activity
- Scalability
- Statistics
- Text
- Workshop (only for Statement)
About an overview of a statement or PL/SQL
The Overview displays general information about the selected entity in the Activity tab, a table that lists the In Oracle sub-states for this entity, and the complete SQL text of the SQL statement.
If bind variables were captured for a statement, a link is displayed that launches to the Bind Variables tab in the SQL tab, with the statement in context, to run a statement with the actual bind variables that are being used. If you drill down to a statement from an execution plan entity, and execution plans were captured for the statement, a link is displayed that launches to the All Plans tab in the SQL tab, with the statement in context. See Wait States - In Oracle and About the Bind Variables view.
The following table explains how the general information is structured.
Table 7 Structure of general information for a statement or PL/SQL
| Item | Description |
|---|---|
| In Oracle (Sum.) | Total time the statement or PL/SQL spent In Oracle. |
| Executions/Execution Counts | Number of times the statement or PL/SQL was executed. See Executions vs. opens and fetches. |
| In Oracle (Avg.) | For a statement only. Total In Oracle time for the statement or number of executions. If Opens + Fetches are displayed, this field displays N/A. |
| Duration (Avg.) | For a statement only. Total overall activity time for the statement or the number of executions. |
| Buffer Gets (Avg.) | For a statement only. Total number of buffer gets for the statement or the number of executions. If Opens + Fetches are displayed, this field displays N/A. |
| Rows Processed (Avg.) | For a statement only. Total number of rows processed by the statement or the number of executions. If Opens + Fetches are displayed, this field displays N/A. |
| Parallel Servers (Min.) | Minimum number of parallel query slaves that executed the statement. |
| Parallel Servers (Max.) | Maximum number of parallel query slaves that executed the statement. |
| End of Fetch Count | Number of times the statement returned all rows to the user rather than returning only the first rows and dropping the cursor. End of fetch count will always be less than or equal to executions. |
| Version Count (Max.) | Shows the maximum number of cursors created for the particular statement in parallel. |
The following table describes the In Oracle (Sum.) table for a statement or PL/SQL.
Table 8 In Oracle (Sum.) table for a statement or PL/SQL
| Column | Description |
|---|---|
| Sub-State | in Oracle sub-state. |
| Bar graph | Graphical representation of the Time column. |
| Time | Amount of time the entity was in this state. |
| % | Percentage of time the entity was in this sub-state. |
Additional information on In Oracle sub-states is available in the stacked bar graph of the In Oracle view and on the In Oracle tab of the table in the Association area.
About In Oracle data for a statement or PL/SQL
The In Oracle view displays a stacked bar graph in the Activity tab on the In Oracle resource consumption over time, for the selected time frame, broken down into the In Oracle wait states. See Wait States - In Oracle.
About the overall activity of a statement or PL/SQL
The Overall Activity view, in the Activity tab, displays a stacked bar graph on the overall activity resource consumption over time, for the selected time frame, broken down into overall activity wait states. See Overall activity.
About the scalability of a statement or PL/SQL
The Scalability view, in the Activity tab, displays a stacked bar graph showing how the average In Oracle response time varies with the number of executions. This graph indicates whether your application scales as the number of sessions or statements executed increases.
When you drill down from an instance or Tier, the In Oracle vs. Executions graph is shown. Otherwise, no graph is displayed.
About the statistics of a statement or PL/SQL
The Statistics view, in the Activity tab, displays a table indicating a change in Oracle statistics for the selected statement or SQL during the specified time frame. The Statistics column displays statistics representing different counters with different units. For more information, see the Oracle documentation and Oracle statistics usage within Precise for Oracle.
About the text view of a statement or PL/SQL
The Text view, in the Activity tab, displays the full SQL text.
About information on the cabinet or folder related to a statement
The Workshop view displays details on the cabinet or folder where the statement is saved, and on how it will be explained.
The following table describes how the information in the Workshop view is structured.
Table 9 Structure of information in the Workshop view
| Item | Description |
|---|---|
| Parsing User | Oracle user name used to explain and parse the statement. |
| Cabinet | Name of the cabinet where the statement is stored. |
| Folder | Name of the folder where the statement is stored. |
| Origin | Source of the statement. The Collector captures most statements automatically when they execute. The following values are possible:
|
| Comment | User-defined comment associated with the statement. |
See Editing the properties of a statement and About the SQL tab.
About the Execution Plan entity
The Oracle server generates execution plans at run-time. Precise for Oracle displays information on these plans so that you can analyze them and determine if any enhancements can be made to improve their execution.
You can drill down from an execution plan to the SQL statements that are using it. You can also associate execution plans with the following entities: Instances, Databases, Programs, Statements, PL/SQLs, other Execution Plans, Users, Modules, Actions, Machines (or their ERP equivalents), Host Users, Oracle Files, Objects, Recent Sessions and Extended Collections.
The following views are available for an execution plan entity:
- Overview
- In Oracle
- Overall Activity
- Scalability
About an overview of an execution plan
The Overview, in the Activity tab, displays general information about the selected entity, a table that lists the In Oracle sub-states for this entity, and the complete SQL text of the SQL statement. See Wait States - In Oracle.
The following table describes the information displayed for an execution plan.
Table 10 General over of an execution plan
| Item | Description |
|---|---|
| In Oracle (Sum.) | Total time spent in Oracle by statements using the selected plan. |
| Execution Counts | Number of executions performed by the statements. |
| In Oracle (Avg.) | Displays the average time spent by the execution plan in the Oracle database. |
| Duration (Avg.) | Displays the average activity time for the execution plan. |
| Buffer Gets (Avg.) | Average number of buffer gets for the execution plan. |
| Rows Processed (Avg.) | Average number of rows processed by the execution plan. |
The following table describes the In Oracle (Sum.) table for an execution plan.
Table 11 In Oracle (Sum.) for an execution plan
| Column | Description |
|---|---|
| Sub-State | In Oracle sub-state. |
| Bar graph | Graphical representation of the Time column. |
| Time | Amount of time the entity was in this state. |
| % | Percentage of time the entity was in this sub-state. |
Additional information on In Oracle sub-states is available in the stacked bar graph of the In Oracle view and on the In Oracle tab of the table in the Association area.
About In Oracle data for an execution plan
The In Oracle view, in the Activity tab, displays a stacked bar graph on the In Oracle resource consumption for the execution plan, over time, broken down into the In Oracle wait states. See Wait States - In Oracle.
About the overall activity view of an execution plan
The Overall Activity view, in the Activity tab, displays a stacked bar graph describing the overall activity resource consumption of the execution plan over time, broken down into overall activity wait states. See Overall activity.
About the scalability view of an execution plan
The Scalability view, in the Activity tab, displays a stacked bar graph showing how the average In Oracle response time varies with the number of statement executions. This graph indicates whether your application scales as the number of statement executions increase.
When you drill down from an instance or Tier, the In Oracle (Avg.) vs. Statement Executions graph is shown. Otherwise, no graph is displayed.
About the Object entity
Whereas statements and PL/SQL are the fundamental building blocks of an application, the objects are the fundamental building blocks of a database. This view gives a DBA an opportunity to tune the objects in the database and is a far more powerful and less intrusive approach than looking at, for example, the V$SEGMENT_STATISTICS table. It is particularly useful if the application code cannot be changed, which is often the case when application packages have been purchased.
The Activity tab shows resource consumption information for objects that are accessed by SQL statements. These are the objects that can be seen in explain plans, namely tables, indexes, and clusters, plus some special objects representing Control file I/O, Log File I/O, Temporary I/O, and Undo I/O. Wait time on other types of objects is not displayed. For example, the Oracle Optimizer will expand a synonym to its underlying table name during the parse phase before the explain plan is created.
You can also view how many partitions an object has in the Association area.
To look at the selected object in detail, or to understand its performance over time, you can launch the Objects tab by clicking the Object tab button for an object in the Main area or the launch icon for an object in the Association area.
An Object can associate with Instances, other Objects, Oracle Files, Statements, PL/SQLs, Programs, Users, Modules, Actions, Machines (or their ERP equivalents), and Host Users.
For an Object, the following views are available:
- Overview
- In Oracle
- Dictionary
About the overview of an object
The Overview, in the Activity tab, displays a table that lists the I/O Wait sub-states for this object. Precise for Oracle records the following sub-states:
- Sequential I/O Wait
- Scattered I/O Wait
- Direct I/O Wait
- Other I/O Wait
- Buffer Wait
- Table Lock Wait3
- Row Lock Wait
Additional information on In Oracle sub-states is available in the stacked bar graph of the In Oracle view and on the In Oracle tab of the table in the Association area. See Wait States - I/O wait.
About In Oracle data for an object
The In Oracle view, in the Activity tab, displays a stacked bar graph on the In Oracle resource consumption over time, for the selected time frame, broken down into the In Oracle wait states. Particularly important for an object is the amount of time spent in I/O wait, Internal Lock wait, and Application Lock wait, that is how well cached the object is. See Wait States - In Oracle.
About the dictionary view of an object
The Dictionary view, in the Activity tab, describes the properties of the object. The information displayed is equivalent to information that can be found in the DBA_OBJECTS table.
About the Oracle File entity
Precise for Oracle shows resource consumption information for those Oracle files where the application spends time waiting directly on I/O. These are most likely to be data and temporary files. I/O wait time on other types of files such as redo log files are less likely because Oracle writes to these asynchronously using a background job such as LGWR. This information can be found in the Statistics tab.
To look at the selected Oracle file in detail, or understand its performance over time, you can launch the Objects tab by clicking the Objects tab button for an Oracle file in the Main area or the launch icon for an Oracle file in the Association area.
An Oracle File can associate with Objects, Oracle Files, Statements, PL/SQLs, and Storage Devices (only if Precise for Storage is installed).
For an Oracle File, the following views are available in the Main Area:
- Overview
- In Oracle
- Dictionary
About an overview of an Oracle file
The Overview, in the Activity tab, displays a table listing the I/O Wait sub-states for this Oracle file. Additional information on In Oracle sub-states is available in the stacked bar graph of the In Oracle view and on the In Oracle tab of the table in the Association area. See Wait States - I/O wait.
About the In Oracle view of an Oracle file
The In Oracle view, in the Activity tab, displays a stacked overtime bar graph on the I/O waits of the Oracle file.
About the dictionary view of an Oracle file
The Dictionary view, in the Activity tab, describes the properties of the Oracle file. The information displayed is equivalent to information that can be found in the DBA_DATA_FILES table.
About the Extended Collection entity
You can define an Extended Collection when you need to carry out a more intensive investigation into a particular performance problem. It lets you capture trace-level information from Oracle, allowing you to see Oracle wait event information for sessions and statements. You can, for example, find a unique index contention or ITL contentions.
The wait event information is similar to that which you can get from Oracle's SQL_TRACE table or event 10046 (for example, alter session set events 10046 trace name context forever, level 8) but with much less overhead. The Precise for Oracle Collector automatically captures all the wait events when it is sampling, but it does not normally store the full details. Rather it stores a summary to keep down the storage requirements. When an Extended Collection is enabled, the full wait event data, including wait event parameters, is stored in a trace file on the monitored server. It is not loaded into the PMDB. Wait event parameters allow you to precisely identify the wait cause, such as the exact block in the Oracle file that has caused a db file sequential read wait event.
You can create an Extended Collection by using the Define Extended Collection dialog box.
When an Extended Collection is no longer required, it should be deleted using either the icon in the Association area, or the action control button when in the Main area. Similarly, pending and running Extended Collections can be stopped, and subsequently deleted.
To see Extended Selections listed in the Association controls, you need to have an Instance selected. When you drill down to an Extended Collection, the time frame in the Time Frame list and all graphs change to the start and end time of the collection.
The information displayed is the same as you would see for the Instance over the same time period filtered by the same criteria. However, in addition to this, an Extended Collection is the container for the Sessions, Statements, and Oracle Events that are captured.
For an Extended Collection, the following views are available in the Main Area:
- Overview
- In Oracle
- Overall Activity
See Defining extended collections and Filtering data.
About the overview of an extended collection
The Overview, in the Activity tab, displays general information about the Extended Collection for the specified time frame and a table that lists the In Oracle sub-states for this entity. See Wait States - In Oracle.
The following table describes how the general information for an extended collection is structured.
Table 12 Structure of general information for an extended collection
| Item | Description |
|---|---|
| Status | Status of the collection, which can be one of the following: Pending, Completed, Running, or Stopped. |
| Criteria | List of programs and other criteria that are included or excluded in the collection. |
| Current Size | Size of the collection. The size is limited when the collection is created. See Defining extended collections. |
| Start Collecting at | Start date and time of the collection. |
| Stop Collecting at | End date and time of the collection. |
The following table describes the In Oracle (Sum.) table for an extended collection.
Table 13 In Oracle (Sum.) table for an extended collection
| Column | Description |
|---|---|
| Sub-State | In Oracle sub-state. |
| Bar graph | Graphical representation of the Time column. |
| Time | Amount of time the entity was in this state. |
| % | Percentage of time the entity was in this sub-state. |
Additional information on In Oracle sub-states is available in the stacked bar graph of the In Oracle view and on the In Oracle tab of the table in the Association area.
About In Oracle data for an extended collection
The In Oracle view, in the Activity tab, displays a stacked bar graph on the In Oracle resource consumption over time, for the selected time frame, broken down into the In Oracle wait states. See Wait States - In Oracle.
About the overall activity view of an extended collection
The Overall Activity view, in the Activity tab, displays a stacked bar graph on the Overall Activity resource consumption over time, for the selected time frame, broken down into the Overall Activity wait states. See Overall activity.
About Session and Recent Session entities (in Table view only)
Precise for Oracle captures a detailed history of every session but does not load this information into the PMDB because it quickly becomes out of date and because of the storage requirements. Instead, this information is saved on the monitored server for only as long as is required. This is accomplished using two mechanisms: Extended Collections and Recent Sessions.
When an Extended Collection is defined, the session information is captured and saved in the Extended Collection files. You can then drill down from an Extended Collection to a Session.
In addition, Precise for Oracle keeps the last n hours of session information on the server and makes it available using Recent Sessions. By default, information for the last four hours is saved. You can specify and change the length of time using Precise Agent Installer (see Installation and Administration), but increasing it will obviously require more storage.
Because session information is only saved for a limited amount of time (by default, 4 hours), if you drill down to recent sessions, you will only see session information for that period, regardless of the time frame specified in the Time Frame list.
A Recent Session can associate with Statements.
For a Session (in an Extended Collection) or Recent Session, the following views are available in the Main Area:
- Overview
- In Oracle
- Overall Activity
See About the Extended Collection entity.
About the overview of a session or recent session
The Overview, in the Activity tab, displays general information about the Session (in an Extended Collection) or Recent Session for the specified time frame and a table listing the In Oracle sub-states for this entity (for details on these sub-states, see See Wait States - In Oracle.).
The following table describes how the general information for a session or recent session is structured.
Table 14 Structure of general information for a session or recent session
| Item | Description |
|---|---|
| In Oracle | Total time the session spent in Oracle |
| User | Oracle user name |
| Host User | Host user name. |
| Machine | Name of the machine connected to Oracle |
| Oracle Process ID | OS-assigned process ID of the Oracle server process |
| Client Process ID | Process ID of the client or application process, if it is running on the same server as the instance; otherwise it is zero. |
| Oracle Process Type | Type of Oracle server process: Dedicated, MTS, or Parallel. |
The following table describes the In Oracle (Sum.) table for an extended collection.
Table 15 In Oracle (Sum.) table for a session or recent session
| Column | Description |
|---|---|
| Sub-State | In Oracle sub-state. |
| Bar graph | Graphical representation of the Time column. |
| Time | Amount of time the entity was in this state. |
| % | Percentage of time the entity was in this sub-state. |
Additional information on In Oracle sub-states is available in the stacked bar graph of the In Oracle view and on the In Oracle tab of the table in the Association area.
About In Oracle data for a session or recent session
The In Oracle view, in the Activity tab, displays a stacked bar graph on the In Oracle resource consumption over time, for the selected time frame, broken down into the In Oracle wait states. See Wait States - In Oracle.
About the overall activity of a session or recent session
The Overall Activity view, in the Activity tab, displays a stacked bar graph on the Overall Activity resource consumption over time, for the selected time frame, broken down into the Overall Activity wait states. See Overall activity.
About the Imported Statement entity
Statements can be imported from external source files into Precise for Oracle and stored in the cabinet and folder hierarchy. To display them in the Activity tab, use the More option in the Association area and click Imported Statements.
To tune a statement, you can launch the SQL tab by clicking the SQL tab button for a statement in the Main area or the Tune icon for a statement in the Association area.
You cannot drill down from an imported statement to other entities.
For an Imported Statement, the following views are available in the Main Area:
- Text
- Workshop
About the text view of an imported statement
The Text view, in the Activity tab, displays the full SQL text of the statement.
About information on the cabinet or folder related to an imported statement
The Workshop view, in the Activity tab, displays details on the cabinet or folder where the statement or PL/SQL is saved, and on how it will be explained.
The following table describes how the information in the Workshop view is structured.
Table 16 Structure of information
| Item | Description |
|---|---|
| Explained on | The date and time of the last explain. |
| Parsing User | Oracle user name used to explain and parse the statement. |
| Cabinet | Name of the cabinet where the statement is stored. |
| Folder | Name of the folder where the statement is stored. |
| Origin | Source of the statement. In this case, it is always Imported from source file. |
| Cost | The cost of the imported statement. |
| Saved on | Information on when the imported statement was saved. |
| Statement | The name of the imported statement. |
| Oracle Hash Value | The Oracle Hash value of the imported statement. |
| Comment | User-defined comment associated with the statement. This is blank until the statement has been saved. |
See Editing the properties of a statement and About the SQL tab.
About storage device entities
In the Activity tab, there are the following Storage device entities:
- EMC storage device
- HP storage device
These entities are only available if you have installed Precise for Storage. For more information on the supported platforms, see Installation and Administration.
The Activity tab offers a unique method for identifying I/O problems in EMC and HP storage devices. It reports I/O wait time instead of just I/O counters. This lets you easily identify the resource that is actually being waited for and tune it instead of guessing by rules of thumb. Furthermore, you can associate the storage device with the applications and statements that are waiting on I/O.
See Precise for Storage, Oracle version - how resource consumption of storage devices is examined.
To look at a storage device in detail or to understand its performance over time, you can launch the Object tab by clicking the Object tab button for a storage device in the Main area or the launch icon for a storage device in the Association area.
When an HP Storage Device is selected, the Launch HP PA button appears to the right of the Define Extended Collection button. This option launches the Web-based user interface of the HP Performance Advisor in another Internet Explorer window.
Storage devices can associate with Objects, Oracle Files, Statements, and PL/SQLs. For a storage device, the following views are available in the Main Area:
- Overview
- I/O Wait
- Dictionary
About the overview of a storage device
The Overview, in the Activity tab, displays a table listing the In Oracle sub-states for this storage device. See Wait States - In Oracle.
The following table describes the In Oracle (Sum.) table for an extended collection.
Table 17 In Oracle (Sum.) table for a storage device
| Column | Description |
|---|---|
| Sub-State | In Oracle sub-state. |
| Bar graph | Graphical representation of the Time column. |
| Time | Amount of time the entity was in this state. |
| % | Percentage of time the entity was in this sub-state. |
Additional information on In Oracle sub-states is available in the stacked bar graph of the In Oracle view and on the In Oracle tab of the table in the Association area.
About the I/O wait view of a storage device
The I/O Wait view, in the Activity tab, displays a stacked overtime bar graph on the I/O waits of the storage device.
About the dictionary of a storage device
This view, in the Activity tab, describes the properties of the storage device. Note that despite the name of the view, these are properties not derived from the Oracle data dictionary.
About the Findings area in the Activity tab
This is only relevant for the Tree view.
The Findings area in the Activity tab displays performance problems detected in the selected J2EE Caller Service or Web Transactions. The findings list is displayed according to severity (highest to lowest).
To view the details of a specific finding, hover over the finding name. The area for the selected finding will expand, displaying information and recommended actions. Click on the relevant link to launch the appropriate tab in context, or Learn more to open the help for that finding.
How to perform actions in the Activity tab
The Tuning Action buttons in the Activity tab enable you to perform the following actions:
See Editing the properties of a statement.
Defining extended collections
The Define Extended Collection button opens the Define Extended Collection dialog box, allowing you to define a period where more detailed Oracle Performance information is collected.
Using the Define Extended Collection dialog box, you can specify the instance that you want to monitor, the name of your collection, the start and stop time, and the maximum size of the trace. You then use the entity table to define the entities that you want to include or exclude. In the Include and Exclude fields, you can use the Oracle SQL-style wildcards '-' and '%' to match zero or more characters and '_' to match a single character. The AND operator is used to produce the final selection.
Try to only include the entities that you need and do not run too many extended collections simultaneously. Although the overhead is still much less than for SQL_TRACE, there can be a slight performance penalty in having to write a lot of information to the traces file on the monitored server.
See About the Extended Collection entity.
To define extended collections
- Click the Define Extended Collection button to open the Define Extended Collection dialog box.
- In the Instance list, select the appropriate instance name.
- If appropriate, type in the Collection name.
- For Start At date and time, select the following data:
- day (number)
- month (name)
- year (number)
- hour (number)
- minute (number)
- Type the desired maximum number of megabytes for collection information.
- Define the criteria for activities to be gathered in the collection. For each entity listed in the Entity column, define whether to include or exclude the entity to the collection.
- Click OK to accept or Cancel to reject the defined entities.
Importing statements
The Import Statement button opens the Import Statements from File dialog box, allowing you to import SQL statements from a file. This dialog box includes three tabs: Source, Catalog, and Options. See Editing the properties of a statement and About the Imported Statement entity.
Defining information on the Source tab
On the Source tab, you can specify the name of the instance and user that will own the statement and the full path to the file containing the SQL. Wild cards in the path are not supported.
If duplicates are detected during the import process, the newer version of a statement will not override the older version.
To define Source tab details
- In the Instance list, select the appropriate instance.
- In the User list, select the appropriate user name.
- In the Path field, you can type in directly the path or click the ... (browser) to locate and select the path.
- Check the box, if appropriate, to view Explain imported statements.
- Click OK to accept or Cancel to reject the Source tab information.
Defining information on the Catalog tab
On the Catalog tab, you can specify the destination cabinet and folder. Either specify the name of the cabinet or folder explicitly by selecting Use the cabinet/folder, or specify a naming convention based on either the name or full path of the file by selecting Use an automatically created cabinet/folder. By default, the statement is saved into the predefined cabinet or folder called Default.
To define Catalog tab details
- Use the upper two lists for a cabinet to select an available parameter.
- Use the lower two lists for a folder to select an available parameter.
- Click OK to accept or Cancel to reject the Source tab information.
Defining information on the Options tab
On the Options tab, you can control the import process and the way that statements are found. You can filter statements in the following ways:
- Ignore strings in either single or double quotes during the import and replace them with bind variables.
- Ignore comments as defined in various programming languages.
- Convert names in respect of hyphens and periods.
- Control the sort of SQL statements imported.
- Ignore names that are likely to refer to system objects.
- Perform a semantic check on the statement by looking up referenced objects in the data dictionary to ensure that the named objects exist.
To define Options tab details
- Check the appropriate box(es) if you want to ignore strings enclosed by single or double quotes.
- Check the appropriate box(es) if you want to ignore specific types of comments.
- Check the appropriate box(es) if you want to convert hyphens or periods to underscores.
- Check the appropriate box(es) regarding statement parameters (select, insert, update, or delete).
- Check the appropriate box if you want to ignore specific statements.
- Check the appropriate box if you want to scan the data dictionary for a column name.
- Click OK to accept or Cancel to reject the Source tab information.
Stopping extended collections
There are two possible actions you can take to stop extended collections. To stop extended collections
- When you have selected an Extended Collection, click Stop to stop this collection if it has already started but has not completed yet.
- As an alternative, when a list of Extended Collections is displayed, you can click the appropriate action icon in the Association area.
How the Activity tab can help you identify performance problems using the Table view
You can identify a performance problem by doing one or more of the following:
- Examining resource consumption of an entire instance
- Identifying heavy resource consumers
- Examining resource consumption over time
- Identifying offending SQL statements
- Correlating Oracle data with ERP data
- Examining the scalability of your application
- Examining EMC Storage devices
Examining resource consumption of an entire instance
When performing a tuning audit, it is very important to analyze and understand the performance behavior of your instances. You may have already drilled down to analyze the performance of a single query or program. However, examining the entire instance's behavior can alert you to the health of your system. The instance represents the performance of the average application. This view will help you answer questions such as: This query suffers from lock wait, but does the entire system suffer from lock wait? If, for example, you discover that your system suffers from I/O wait and you tune a query that performs memory operations, you most likely will not improve the entire system's I/O wait problem. So examining the entire instance can provide a quick overview of the dominant resources consumed.
The following example shows how to examine resource consumption of an instance. To examine resource consumption of an entire instance
- In the Instance list, choose the item you want to analyze.
- In the Time Frame list, choose the period of time you want to analyze.
- On the View controls in the Main area, click Overview. Examine the entire instance and determine which are the dominant resources that are consumed by your system. For our example, we have an Activity tab that shows an instance that is fairly busy. In the Main area, the instance shows that it has spent 1 day out of 7 executing. But it has spent 40% of that time on Other Lock Wait. This is an unproductive wait.
Launch to the Statistics tab to find out more about the underlying Oracle wait events comprising the Other Lock Wait. It is most likely to be an enqueue. In fact, the instance has spent over 50% of its time in unproductive waits (not using CPU or I/O).
As a rule of thumb, a healthy system should have a high Using CPU value; a 10-15% I/O Wait, and the remaining non-productive wait states should show values that are as low as possible. For databases that process large data volumes, such as a data warehouse, the I/O Wait percentage may be higher. It is true, however, that applications/statements that experience high Using CPU or I/O Wait times may be performing excessive logical I/Os and should be investigated. To determine this, it is important to look at the actual time spent waiting (in hh:mm:ss) as well as just the percentage.
Identifying heavy resource consumers
Precise for Oracle lets you drill down to application components (such as Programs, Users, Host Users, Machines, Statements, and so on) to determine which application component consumes the most resources. To do so, click Programs from the Association controls to show a breakdown of the Oracle activity by program. You can now click any of the programs to see just the activity for that program and the entities that contributed to that activity. This process is iterative and you may continue to drill down until you discover the application component that you want to tune.
There are several reasons to drill down and focus on different application components:
- During the tuning process, you drill down to determine which are the top resource-consuming components. Tuning a statement (User, Program, Machine, and so on) that consumes most of the resources will free them for other entities. The tuning process is an iterative process. Continue to list all components, examine their resource consumption, and focus on several of them until you have completed the tuning process.
When you try to analyze user experience, you need to isolate one user's activity from the other users. To achieve this, you can focus on a single User or Machine.
When trying to determine which application component to drill down to, take into consideration both the total In Oracle time of the application and its number of Sessions or Executions and Duration (Avg.). Otherwise, you can try to tune a program that runs once a year, consuming 20 hours, instead of tuning a program that consumes 2 seconds but runs every time a user logs on to the system.
You can display the average duration for statements with the format shown as hh:mm:ss.
The following example shows how to drill down to application components and identify resource consumers. For our example, the Active tab shows a list of programs that you can drill down to in the Tree pane. We want to drill down to the program that spent the most time.
To identify heavy resource consumers
- In the Instance list, choose the item you want to analyze.
- In the Time Frame list, choose the period of time you want to analyze.
- On the Association controls in the Association area, click Programs. This shows a breakdown of the Oracle activity by program.
- You can now click any of the programs to see just the activity for that program and the entities that contributed to that activity.
- Continue to drill down until you discover the application component that you want to tune.
Examining resource consumption over time
When you analyze and tune the performance of an application component (such as Program or Statement), it is important to consider its performance over time. Precise for Oracle lets you view the component's performance over a selected time frame.
There are several reasons to study a component's performance over time:
- When analyzing a performance problem, you will want to determine if it is a random problem or has happened before.
- To look for a pattern. For example, does the lock problem always happen on Tuesday at around 10 AM?
- You will want to determine how your system is behaving throughout an entire day. For example you may observe that during the night, your system experiences much more I/O wait than during the day.
The following example shows how to examine resource consumption over time. To examine resource consumption over time
- In the Instance list, choose the item you want to analyze.
- In the Time Frame list, choose the period of time you want to analyze.
- In the table, click a program to drill down to. The tab now shows the result of clicking a program. The Main area shows the In Oracle (Sum.) overtime graph of the activity for the selected program. For an example, the overtime graph may show the selected program to run only during the working day, but is performing bulk inserts.
Although this particular example is performing a simple load test, in a production application you may want to consider running such statements outside of working hours.
Identifying offending SQL statements
Having identified a major resource consuming entity, you can further drill down to the statements and PL/SQL executed by that entity. These may include long running SQL statements and SQL statements that use few resources but were executed frequently. See Identifying heavy resource consumers.
In many cases, analyzing the queries executed by the entity and tuning them will result in the most performance gain. For each statement, you can do the following:
- View which entities executed the statement.
- View resources consumed by the statement, which lets you determine if the statement is CPU or I/O bound, waiting for a lock, and so on.
- View resource consumption patterns, which indicate if the statement execution is affected by excessive use of the same resource by another statement.
- View access plan information and display summary information on the operations used in the access plan. This is available only for Statements.
- Tune the statement by selecting the SQL tab or the Tune icon.
The following example shows how to identify offending SQL statements. For our example, we have identified a major resource consuming entity and have drilled down to the statements and PL/SQL executed by that entity.
To identify offending SQL statements
- In the Instance list, choose the item you want to analyze.
- In the Time Frame list, choose the period of time you want to analyze.
- In the Association area, click the General tab so as to view the SQL text, number of executions, average In Oracle time, and the percentage contribution to the overall In Oracle time. In the Main area, the bar graph shows a breakdown of the In Oracle time so that you can easily see if a statement is CPU or I/O bound, or waiting on other things.
- In the Association area, click the Statistics tab to view Oracle statistics for each statement. For example, you can see the number of Logical Reads, which is the total of the Consistent Gets + DB Block Gets. Similarly, you can see the number of Physical Reads, which is the number of reads that involved a physical I/O from disk because the data was not available in the Oracle Buffer Cache.
- The tab shows that the number of logical and physical reads is high and contributing to the I/O wait time. In addition, it indicates the number of Sorts and how many were performed in memory compared to disk. Disk sorts take longer than sorts in memory, so attempts should be made to avoid them where possible by sizing the Oracle sort areas settings appropriately and tuning statements that do unnecessary sorting. For our example, the number of sorts is low and there is little sorting to disk.
Correlating Oracle data with ERP data
Installing the Precise for Oracle Interpoint extension lets you correlate Oracle information with ERP information. For example, if you install Interpoint for SAP, you will be able to display the breakdown of your Oracle activity into SAP Work Types.
The following example shows how to correlate Oracle data with ERP data. To correlate Oracle data with ERP data
- In the Instance list, choose the item you want to analyze.
- In the Time Frame list, choose the period of time you want to analyze.
- In the Activity tab, the overtime graph indicates that the major bottleneck is the I/O wait. However, in this 24 hour period, nearly all the I/O wait time arises from batch jobs (SAP Background).
- Check the interactive sessions (SAP Dialog). Interactive sessions (SAP Dialog) are not waiting much on I/O. If the emphasis in this application is on tuning interactive sessions, then despite first appearances, tuning the I/O is not going to make an appreciable difference.
- Drill down to the entity whose data you want to correlate. For our example, drill down to SAP Background to view the transactions and statements, to investigate why batch jobs are taking so long.
Examining the scalability of your application
Applications are called upon to support the addition of more and more users, and data, over the years. One of today's tasks is to ensure that our applications and servers are scalable for tomorrow's tasks.
The following example shows how to examine scalability of your application. In the Activity tab, an application runs a particular statement over 10 million times during a selected time frame.
To examine scalability of your application
- In the Instance list, choose the item you want to analyze.
- In the Time Frame list, choose the period of time you want to analyze.
- On the View controls in the Main area, click Scalability. The Scalability view shows that the number of Executions has remained fairly constant.
- Check the In Oracle time. For our example, the In Oracle time for the statement is now much lower (towards the right-hand side of the graph), after some tuning has taken place. In other words, it should be possible to increase the number of executions and hence the throughput of the application by a factor of 3 for the same resource consumption.
Examining EMC Storage devices
Precise for Storage, Oracle version, supports EMC devices and lets you see the resource consumption of the EMC Storage devices from the application's point of view.
The following example shows how to examine EMC Storage devices resource consumption. To examine EMC Storage devices
- In the Instance list, choose the item you want to analyze.
- In the Time Frame list, choose the period of time you want to analyze.
- For our example, the Association area in the Activity tab shows the total I/O wait on each of the devices used by instance ora920 in just over one hour, broken down into scattered and sequential I/O types.
- Check the I/O wait on the devices. The I/O wait on devices, for our example, 0E1 and 0E0 is significantly higher than for 0DE and 0DF. These are the busy devices as far as this instance is concerned.
- Drill down into device 0E1 to see its resource consumption over time. Find out which statements have been waiting on it.