What is the IDERA Dashboard?
The IDERA Dashboard is a common technology framework designed to support the entire IDERA product suite. The IDERA Dashboard allows users to get an overview of the status of their SQL Servers and hosted databases all in a consolidated view, while providing users the means to drill into individual product dashboards for details. The IDERA Dashboard supports multiple copies of SQL diagnostic manager installations.
The IDERA Dashboard is comprised of the following tabs:
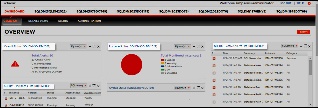
What actions can be performed in the Overview tab of the IDERA Dashboard?
|
In the Overview tab, you can perform the following actions:
- Expand or collapse a widget
 .
. - View a widget in full size
 .
. - Remove a widget
 .
. - Filter widget information by SQL Diagnostic Manager Repository (Click image to view full size).
|
Customize the Main Navigation tab order
Users can customize the main navigation tab order of the IDERA Dashboard in the Configure Navigation order widget of the Administration view.
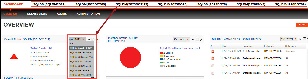
Customize the Overview tab
Users can customize the Overview tab by adding, removing, and arranging widgets in the Configure Dashboard Views widget of the Administration view.
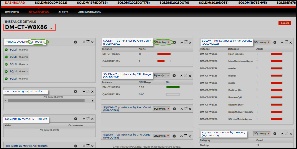
What actions can be performed in the Details view of the Idera Dashboard?
|
In the Details tab, you can perform the following actions:
- Expand or collapse a widget .
- View a widget in full size .
- Remove a widget .
- Filter widget information by SQL Diagnostic Manager Repository.
Customize the Details view tab
Users can customize the Details view tab by adding, removing, and arranging widgets in the Configure Dashboard Views widget of the Administration view.
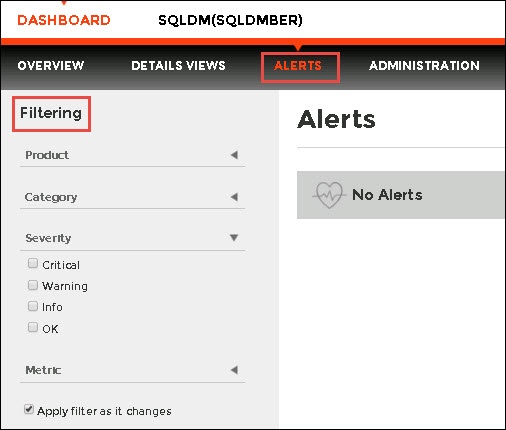
What actions can be performed in the Alerts view of the IDERA Dashboard?
In the IDERA Dashboard users can access information on all registered products current alerts and filter them based on:
- Product
- Category
- Severity
- Metric
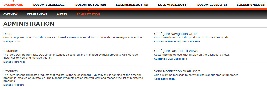
What actions can be performed in the Administration view of the IDERA Dashboard?