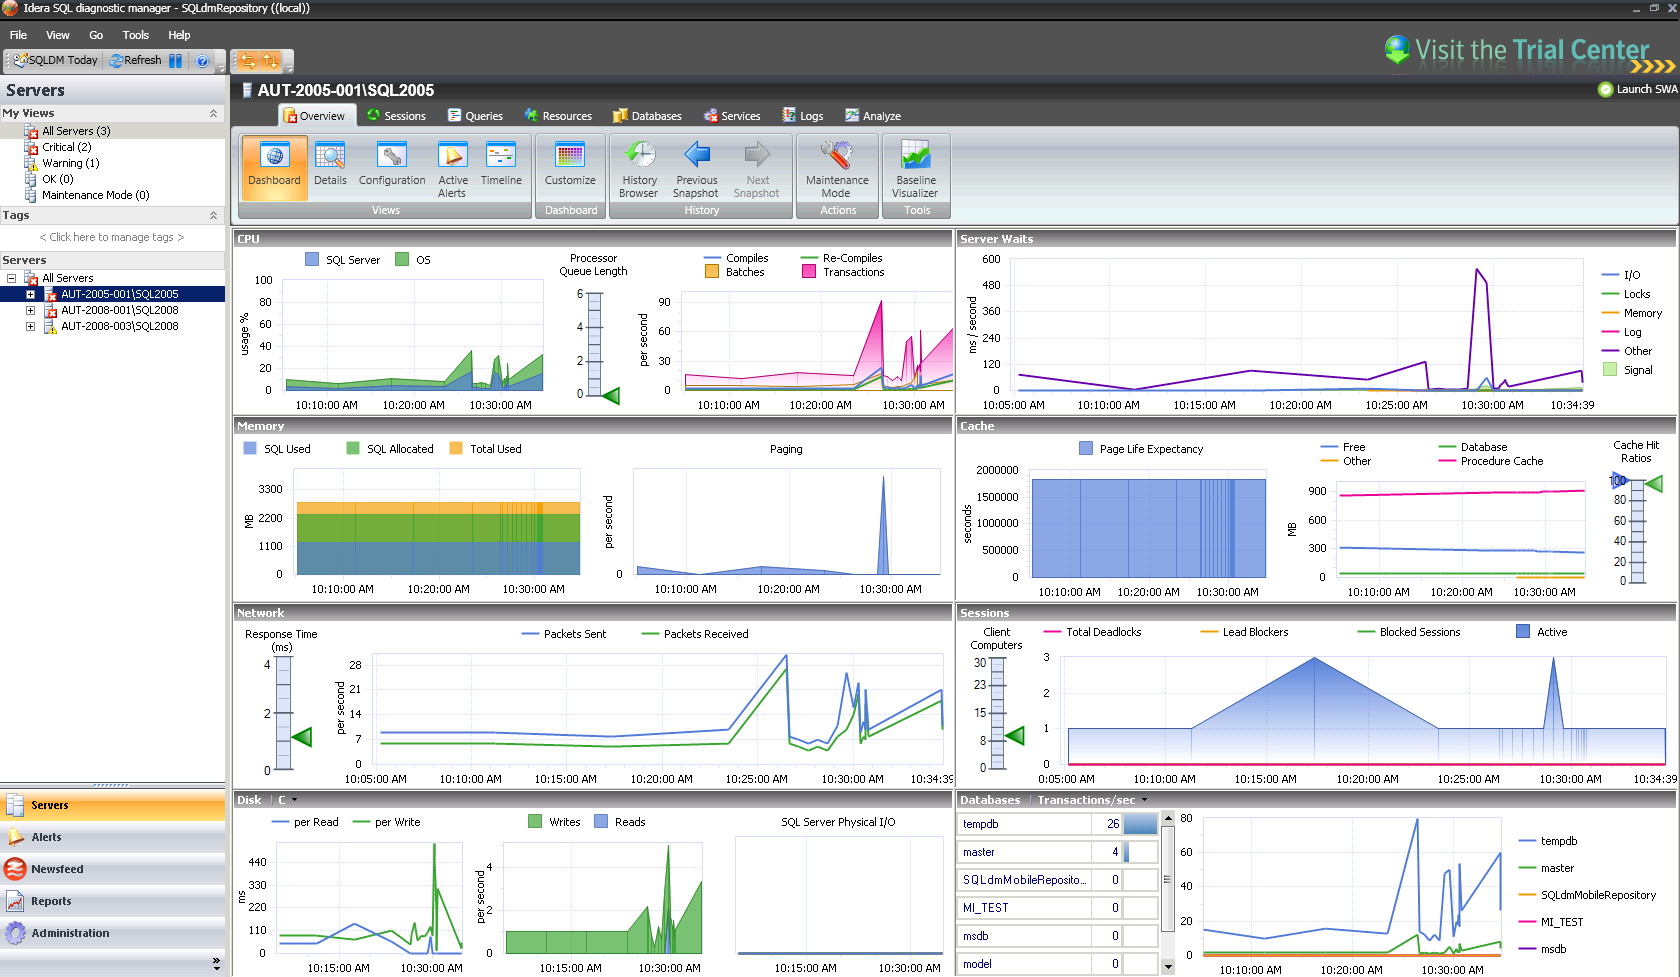
The Overview tab contains the following views:
- Dashboard view where you can see an overview of the instance.
- Details view that lets you create charts with the specific data items you need.
- Configuration view that allows you to view the configuration information of your SQL Server.
- Active Alerts view where you can see all outstanding alerts for this instance.
- Timeline view where you can see a timeline of events as they occurred on this instance.
Access the Overview tab
SQL Diagnostic Manager provides two paths to access the Overview tab. The first access path is simply by clicking the appropriate monitored SQL Server instance. The Overview tab is the default view when you first click an instance. The second access path is used when you are on a different tab within an instance. In this situation, click the Overview tab.