This section includes the following topics:
- About the Precise bar
- Tasks common to most tabs
- About the Alerts user interface
- Launching Alerts
- Alerts user interface elements
About the Precise bar
The Precise bar enables you to keep track of where you have been and provides various controls. The following table below describes the function of each of the toolbar buttons.
Table 2-1 Precise bar functions
| Icon | Name | Description |
|---|---|---|
 | Back | During a work session, keeps track of where you have navigated to. The Back button enables you to navigate between previously visited views. The Back control displays your previous view. |
 | Forward | Enables you to navigate to the next view. This button is only enabled if you clicked Back or if you chose a history option. |
 | Stop | Stops a request for information from the server. |
 | Refresh | Updates the data currently displayed. |
 | Home | Navigates to the highest level entity, usually the instance or tier (all instances). The time frame settings remain the same. |
 | Send | Opens new email message in your email program with the link to the current application in context. |
 | Help | Opens the online help in context. |
 | Favorites | Enables you to add or remove favorites in your Favorites list. |
 | Settings | Lets you configure process availability settings. |
 | AdminPoint | Launches Precise AdminPoint. |
Tasks common to most tabs
The following tasks are commonly performed in most tabs:
- Switching to a different tab
- Determining which table columns to display
- Copying data to the clipboard
- Exporting to Precise Custom Portal
- Adding, viewing, and deleting Favorites
- Sending an email message
Switching to a different tab
You can easily switch between the different tabs using the Tab Selection bar. When you start your Precise product, the Dashboard tab opens by default. For other Precise products, another tab will open by default. The button of the selected tab is displayed in orange.
To select a tab
- Click a button on the Tab Selection bar to display information on the selected entity in a different tab.
Determining which table columns to display
Tables are used to display information about a set of related entities. It is possible to determine which columns to display in the area tables.
To determine which columns to display in a table
- Click the Table icon on the upper right-hand side of a table and select Column Chooser.
- In the Table columns dialog box, click the arrows to move the names of the columns that you want to display to the Visible box and the ones that you do not want to display to the Invisible box.
- Click OK.
Copying data to the clipboard
At times you may want to save data displayed in the table area in a Microsoft Excel spreadsheet for further analysis. To copy data displayed in the table to the clipboard
- Click the Table icon on the upper right-hand side of the table and select Copy to clipboard.
- Open a Microsoft Excel spreadsheet and choose Paste from the Edit menu.
Exporting to Precise Custom Portal
The Export to Precise Custom Portal Portlet feature enables you to export the view of the chosen table or graph and generate a portlet with that view in Precise Custom Portal, so that it will provide you with another way of monitoring your application.
Prerequisites
To be able to use this feature, you need to have the following rights in Precise:
- View permissions to all Tiers in the application.
If you do not have sufficient rights, you will get an error message when trying to execute this feature.
Exporting the information
You can either export a table view or a graph view.
The name field has the following restrictions: maximum 100 characters.
To export a table view
- Click the Column Chooser icon.
- Select Export to Precise Custom Portal Portlet.
- Insert a name in the name field that clearly describes the table view.
- Click OK.
To export a graph view
- Right-click the graph.
- Select Export to Precise Custom Portal Portlet.
- Insert a name in the name field that clearly describes the graph view.
- Click OK.
Adding, viewing, and deleting Favorites
The Favorites feature allows you to save a specific location in your application and to retrieve the same location later without having to navigate to it.
About the Favorites feature
The new Favorites feature includes the following options:
- Relative Time Frame. Saving relative time frame instead of static date. For example, saving the last 7 days will always display the last 7 days, depending on the day entered.
- One click to specific location. Once you open Precise by launching a saved Favorite item, you will not have to enter a login credential nor click the login button.
- IE Favorites support. Adding a new Favorite item in Precise will also add it to the IE Favorites menu.
- Auto Complete. The Favorites dialog includes a new combo box which supports Auto Complete.
- Auto Naming. The Favorites dialog generates item names based on the current location.
UI description
An Add/Delete Favorites option under the Favorites menu allows you to save the current location or delete an existing one.
To add a new Favorite location
- On the Add/Delete Favorite dialog box, enter the name of the new Favorites entry.
- Click Add. The dialog box is closed and the new Favorite is added to the list.
To view a Favorites location
- On the Precise bar, click Favorites.
- Select the Favorites location you want to view.
To delete an existing Favorite location
- On the Add/Delete Favorites dialog box, select the Favorite location to be deleted.
Click Delete. The dialog box closes and the selected Favorite is deleted from the list.
The favorite address is displayed in the Address field and cannot be edited.
Sending an email message
You can send an email message to one or more recipients from the Precise toolbar. The default subject for the message will be “Link to a Precise application”.
The email will include a link to the Precise product in the current context (time frame and selected entries).
To send an email message
- Click the email icon on the Precise toolbar. The default email program opens.
- Fill in the required fields and click Send.
About the Alerts user interface
Alerts is a Web-based application. This means that you do not need to install any special software on your desktop to use Alerts. Instead, the application opens in a normal browser window.
Because Alerts is Web-enabled, you can access it from almost any location that is connected to the World Wide Web as long as you can access your Alerts FocalPoint server.
Although Alerts opens in a browser window it is important to understand that it is an application rather than a Web site. To perform activities within Alerts, you must use the Alerts controls, not the ones of your browser. You should not open information in a New Window, and you should not use the Back or Refresh hot-keys. Instead, use the Precise bar.
Launching Alerts
You launch Alerts from the Application screen or by selecting the Alerts tab on the Dashboard screen. From the Alerts screen, you can view alerts from Application level down to metrics level. Each of these alert levels helps you to isolate the causes of the alerts in the monitored application.
Red or yellow AppTier icon colors indicate a critical or near-critical alert condition. Green AppTier icon colors indicate normal conditions. For a description of the metric status icons see “About the Metric status legend” on page 17.
Alerts can be generated for the following:
- Activity
- Service
- Trending
- Status
To launch Alerts from the Applications screen:
- Click the required application from the Applications list.
- In the Environmental map area, do one of the following:
- Click Alerts.
- Click a specific Tier, and from the pop-up menu select Alerts. The Alerts screen opens for the specified Tier tab.
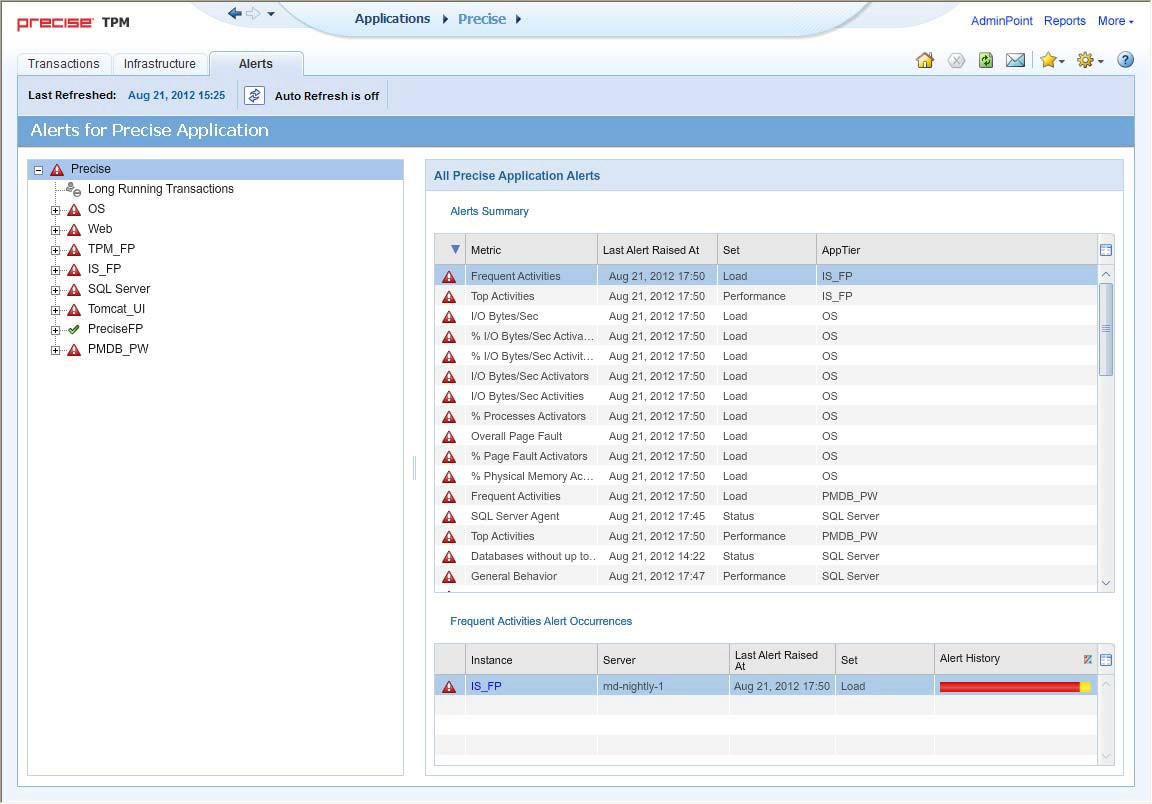
The following figure shows an example of the information displayed when you open the Alerts tab for the first time.
Figure 2-1 Alerts Tab
Alerts user interface elements
The Alerts user interface consists of one main screen from which you can access the various alerts.
The Alerts tab display performance, availability, and management data on monitored instances in your application, in table format.
The left side of the main screen lists the Alerts in the following levels:
- Application level
- AppTier level
- Instance level
- Metric level
The right side of the main screen provides details of the alerts according to the element selected in the tree on the left side of the screen as follows:
- Application level. All application alerts listing:
- Alerts Summary
- Alert Occurrences
- AppTier level. AppTier alerts listing:
- Alerts Summary
- Alert Occurrences
- Instance level. Instance alerts listing all alert instances
- Metric level. Details of the instances of the alert including the following details:
- Metric description
- Alert current and historical occurrences
- Alert value
- What to do next
About the Tab heading
The Tab heading provides information about the refresh status. It contains the following:
- Display of the date–and–time when the current tab was last refreshed.
- Auto-Refresh toggle button that also indicates whether it is On or Off. When the Auto-Refresh is On, the tab information is refreshed every one minute.
The Auto-Refresh is On by default, to display the most updated information, in the Cross-Tiers tab and Instances tab of the Tier tab.
The Auto-Refresh is Off by default in the Metrics tab of the Tier tab, because this tab is used for further investigation of specific metrics.
About the Metric status legend
The metric status legend contains icons that indicate the different alert statuses. The table below describes the status icons.
Table 2-2 Status icons
| Icon | Status | Description |
|---|---|---|
 | Key Metric | Indicates that the metric is defined as a key metric, which is a metric that monitors an important performance aspect. You can define a metric as a key metric through the Thresholds tab of the metric properties. |
 | Critical | Indicates that the metric value exceeds the defined Critical threshold value. |
 | Near-Critical | Indicates that the metric value exceeds the defined Near-Critical threshold value. |
 | Normal | Indicates that the metric value falls in the defined acceptable range. |
 | Down Time | Indicates that the metric is not sampled due to Down Time definition of the metric's technology or when the sampled instance is not available. You can set the Down Time definition through AdminPoint. See the Precise Administration Guide. |
 | Disabled | Indicates that the metric is disabled, and therefore it does not sample or generate alerts. A metric is disabled in case the related Precise product is not installed, or the metric properties are set to stop sampling. |
 | Not Sampled | Indicates that the metric is not sampled since InformPoint was started, or errors occurred during the sampling process. |
See “About editing metric properties” on page 24.
About the Alerts tree
The Alerts tree displays the highest alerts in the Tier level, thus simplifying the identification of exceeding metrics.
About Alert metrics
The right side of the Alerts tab displays the following information according to the element selected in the Tiers tree.
- All Application Alerts
- Application Level Metrics
- AppTier Alerts
- Instance Alerts
- Metric Details
All Application Alerts
The table below describes the details displayed in the All Application Alerts table that is displayed when you select the application in the Alerts tree.
Table 2-3 Alerts Summary - All Application Alerts
| Column | Description |
|---|---|
| Alert | Indicates the highest alert severity level of the metric. |
| Metric | Indicates the metric name. |
| Last Alert Raised At | Indicates the timestamp of the most recent sample. |
| Set | Indicates the metric set. |
| AppTier | Indicates the AppTier name of the metric. |
When you select an entry in the Alerts Summary table, details of the instance of the alert are displayed in the Metric Alert Occurrences table.
The table below describes the details displayed in the Metric Occurrences table.
Table 2-4 Metric Alert Occurrences
| Column | Description |
|---|---|
| Instance | Indicates the instance that is sampled by the metric. |
| Server | Indicates the server name where the instance (that is sampled by the metric) is running. |
| Last Alert Raised At | Indicates the timestamp of the most recent sample. |
| Set | Indicates the metric set. |
| Alert History | Appears only in the Metrics table. Indicates the number of normal, near-critical, and critical alerts that occurred during a pre-defined history period. The number of alerts does not include user-triggered samples (Resamples) from that history period. You can display the bar either in absolute values or relational values (percentage of the total alerts) by clicking the rectangle in the column header. You can modify the history period through the Settings dialog box. |
Application Level Metrics
Lists the Application level metrics for all applications. In version 9.5 the only Application level metric is Long Running transactions. The details shown on this page are the same as those show for Instance Alerts, see “Instance Alerts” on page 19.
AppTier Alerts
The table below describes the details displayed in the AppTier Alerts table that is displayed when you select an
AppTier in the Alerts tree
Table 2-5 AppTier Alerts
| Column | Description |
|---|---|
| Alert | Indicates the highest alert severity level of the metric. |
| Metric | Indicates the metric name. |
| Last Alert Raised At | Indicates the timestamp of the most recent sample. |
| Set | Indicates the metric set. |
When you select an entry in the AppTier Alerts table details of the instance of the alert are displayed in the Metric Alert Occurrences table.
The table below describes the details displayed in the Metric Occurrences table.
Table 2-6 Metric Alert Occurrences
| Column | Description |
|---|---|
| Instance | Indicates the instance that is sampled by the metric. |
| Server | Indicates the server name where the instance (that is sampled by the metric) is running. |
| Last Alert Raised At | Indicates the timestamp of the most recent sample. |
| Set | Indicates the metric set. |
| Alert History | Indicates the samples taken organized by time. |
Instance Alerts
The table below describes the details displayed in the Instance Alerts table that is displayed when you select an instance in the Alerts tree.
Table 2-7 Instance Alerts
| Column | Description |
|---|---|
| Alert | Indicates the highest alert severity level of the metric. |
| Metric | Indicates the metric name. |
| Last Alert Raised At | Indicates the timestamp of the most recent sample. |
| Set | Indicates the metric set. |
| Alert History | Indicates the samples taken organized by time. |
When you select an entry in the Instance Alerts table details of the instance of the alert are displayed in the Metric Details table (see Metric Details).
Metric Details
The table below describes the details that displayed when you select a metric in the Alerts tree or in the Instance Alerts table (see Instance Alerts).
Table 2-8 Metric Details
| Column | Description |
|---|---|
| Metric Description | Detailed description of the metric. |
| Alert Current and Historical Occurrences | Bar graphic indicating current and historical occurrences. |
| Alert Value | Displays a sample value for the alert. |
| What To Do Next | Suggests various option as a next step. |
IDERA Website | Products | Buy | Support | Community | About Us | Resources | Legal