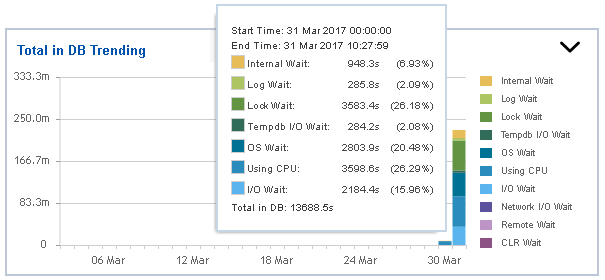
The Total in DB Trending graph displays information measured in seconds about Internal Wait, Log Wait, Lock Wait, Tempdb I/O Wait, OS Wait, Using CPU, I/O Wait, Network I/O Wait, Remote Wait, and CLR Wait. All Waits are color-coded and they are related to the Total in DB Highlights graph.
You can drill down into different time intervals, click and drag the rectangle over the graph.
SQL Workload Analysis add-on provides a granular breakdown of wait states with easy drill-down to isolate problems quickly.
IDERA | Products | Purchase | Support | Community | Resources | About Us | Legal