The SQLDM Today page provides a current overview of all the monitored SQL Server instances in your environment and offers you shortcuts to the following options:
- Five most critical servers
- Five servers you recently monitored
- All active alerts in your SQL Server environment
- The most recent server status updates and coworker posts from the IDERA Newsfeed
- Access to the SQL Diagnostic Manager web console
Access the SQLDM Today page
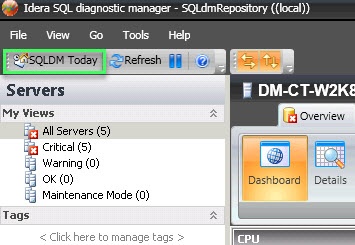
You can open the SQLDM Today page from the SQLDM Console menu by clicking the SQLDM Today button as shown in the following image.
Use SQLDM Today to view the general health of your environment
SQL Diagnostic Manager gives you a quick glance at the overall health of your environment in the Status section of the SQLDM Today page. The main categories of data shown in this view include the following areas:
Status Summary
The Status Summary section displays the number and type of active alerts for all of your SQL Server instances. SQL Diagnostic Manager displays a large icon that shows you at a glance the current highest level of severity of your servers accompanied by the number of your servers in that state.
Most Critical Servers
SQL Diagnostic Manager provides a list of up to five of your most critical servers so you can quickly access that SQL Server instance and review the issue.
Recent Servers
The SQLDM Today page provides a list of your five recently-accessed SQL Server instances, with the most recent visit appearing at the top of the list.
Get the most from SQL Diagnostic Manager
The Get Started tab of the SQLdm Today page provides links for you to access content in the SQL Diagnostic Manager Trial Center including video tours that cover important features and SQLDM navigation. You can also find Webcasts, white papers, and the SQL Server Performance Blog for additional information that you may find useful when using SQL Diagnostic Manager.
View your recent active alerts
SQL Diagnostic Manager displays a list of your most recent active alerts on the SQLdm Today page Active Alerts tab. While this view displays alerts for all your monitored SQL Server instances, you can view additional alert information for a specific server instance by using the right-click context menu. This additional information includes a real-time view and a shortcut to configure your alerts.
If you are aware of an alert and do not want to see it in your list or have it impact the associated server, you can "snooze" or temporarily postpone the alert from appearing for a set number of minutes. When you snooze an alert, SQL Diagnostic Manager clears the alert which no longer impacts the state of the monitored server until the snooze period expires. To snooze an alert, right-click the specific alert, and then select Snooze Alert. Select the appropriate number of minutes you want to alert to snooze, and then click OK.
To snooze an alert on the Active Alerts tab:
- On the Active Alerts tab of the SQLDM Today page, right-click anywhere on the row containing the alert you no longer want to view.
- Select Snooze Alert.
- Type or scroll to select the number of minutes you want the alert to snooze, and then click OK.
Use the Web Console
The SQL Diagnostic Manager web console is a web application designed to provide read-only access to the overall status of your SQL Server environment to help diagnose any issues. The web console provides key information simply through dashboards and high level views to a large user base such as IT, helpdesk, and DBAs. You can access the web console from any connected browser and grant access as you deem necessary. The SQLdm Today page provides the URL to launch the web console.
The SQL Diagnostic Manager web console is integrated with the IDERA Dashboard.
Use IDERA Newsfeed to track your SQL Server issues
The IDERA Newsfeed is a new way for you to share knowledge with other DBAs and managers regarding critical and current SQL Server issues. To learn how to set up and use the IDERA Newsfeed.
