Here are the Advanced settings you can configure when connecting to MySQL server.
Settings:
- System Metrics
- Data Collection
- Replication
- Galera
- MySQL Error Log
- MySQL Query Log
- Audit Log
- Sniffer
- Deadlock
- Monitors
- Real-Time
- Connection
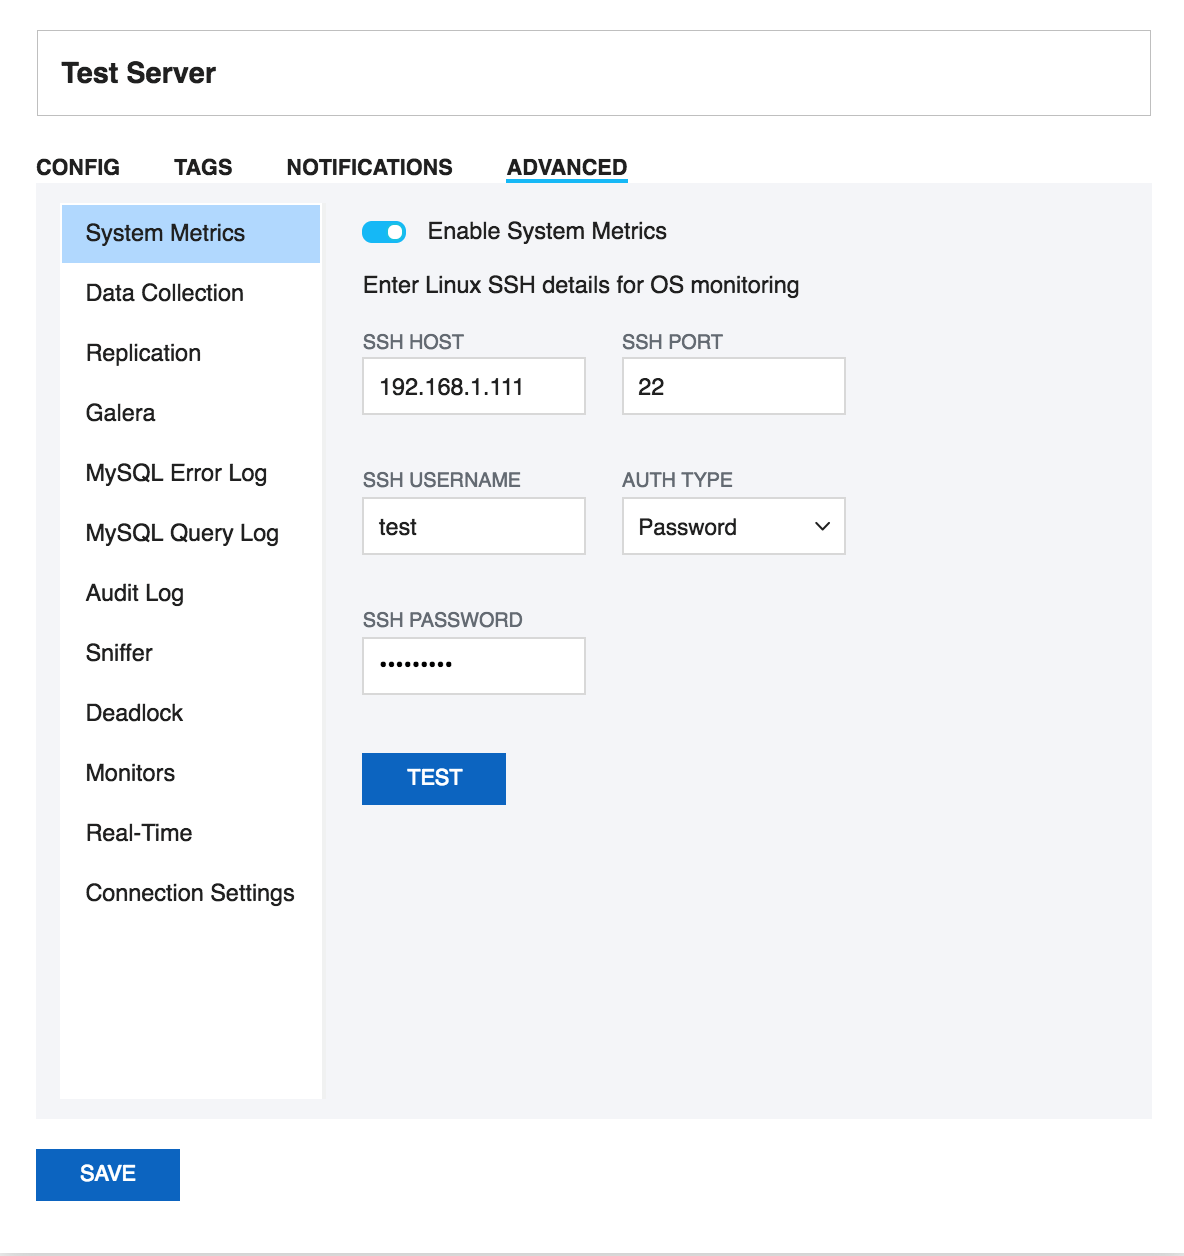
System Metrics (applicable for Linux based systems)
In the event that you would like SQL DM for MySQL to use SSH when communicating with this server, you can configure it from this tab. SQL DM for MySQL disables SSH communications by default. In order to use it, you need to click the Enable System Metrics switch. Doing so provides a series of configuration options needed to enable SSH on the server.
Please refer to System Privileges for further details of privileges needed for this feature.
If SSH tunneling to MySQL is configured successfully for this registration you can use those same details here too, provided that SSH tunnel user has enough privileges.
Using SSH connections
To create a SSH connection you need the following details:
- SSH Host: Host of the machine on which SSH server is running.
- SSH Port: Port on which SSH server is listening. By default, it is 22.
- SSH Username: Username to access the SSH server (Note: not the MySQL server).
- Authentication type: Specify the type of authentication to use. This can be either key based or password based.
- If you have specified Authentication type as Password - Provide the password.
- If you have specified, Authentication type as Key - You should note that SQL DM for MySQL only supports ''OpenSSH standard key format'' for key based authentication in SSH connections.
- Private Key: Paste the content of your private key file. Again, do not specify the path to your private key file.
- Passphrase: Enter the passphrase for your private key file (if any). This can be left blank, if no passphrase was given for the private key.
Data collection options
If you want to collect data from the server, you need to select "Enable Data Collection", so SQL DM for MySQL collects and stores various MySQL and OS metrics.
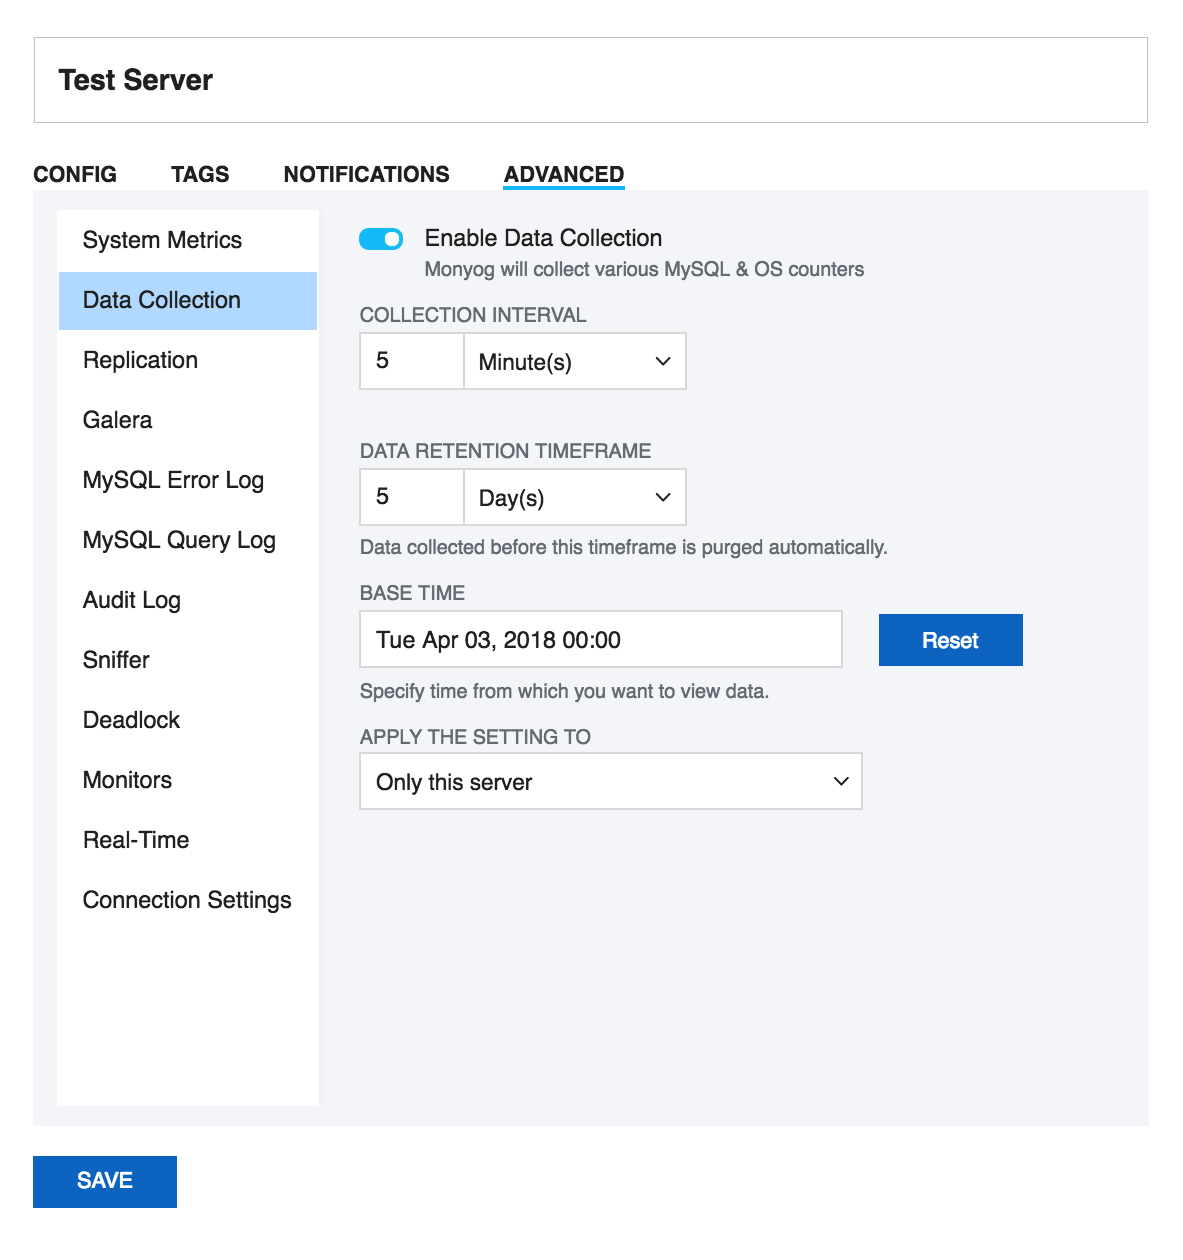
Define the collection interval for every server as you want.
You can also define the time interval between two successive retrievals of data. For production systems a setting between 2 and 10 minutes is a good place to start.
Data retention time frame
SQL DM for MySQL is designed for storing large amounts of data for long periods of time. Data collected before the specified timeframe is purged automatically. Timeframe may be specified in seconds, minutes, hours and days for a particular server.
Base time
For calculation of uptime-based counters the current value of each status variable is compared with either of those,
- server status variable 'uptime'
- server status variable 'uptime_since_flush_status'
- SQL DM for MySQL 'base time' setting
If SQL DM for MySQL 'base time' setting is defined and server status variable uptime_since_flush_status is available then, uptime_since_flush_status is used, if it is not available then base time is used.
The reason for this implementation is that if FLUSH STATUS is executed with a MySQL server, the server status variables are reset to the same value as after a server restart. There is one important exception however and that is the 'uptime' status variable itself. This single status variable is not affected by FLUSH STATUS.
So, to get true uptime-based counters in SQL DM for MySQL with servers that do not support the uptime_since_flush_status variable you need to define a 'base time' in SQL DM for MySQL greater than or equal to the time where FLUSH STATUS was executed last time.
But also if uptime and/or uptime_since_flush_status is large ('old') you may use 'base time' setting to analyze uptime-based counters on an interval defined by you. For instance, if the server has been running for months you may choose to analyze uptime-base counters based on data collected from a specific time only as you have defined it.
Also, note that if the 'base time' is smaller than uptime (or uptime_since_flush_status if available), then 'base time' setting is ignored. Using a 'base time' larger than 'uptime' and/or uptime_since_flush_status, then base time is considered. If a base time is in future, then most recent collection time is considered (similar to Delta).
Replication Settings
SQL DM for MySQL monitors MySQL replicas by issuing a SHOW SLAVE STATUS on the slaves. SQL DM for MySQL can also auto-register slaves, given the master details.
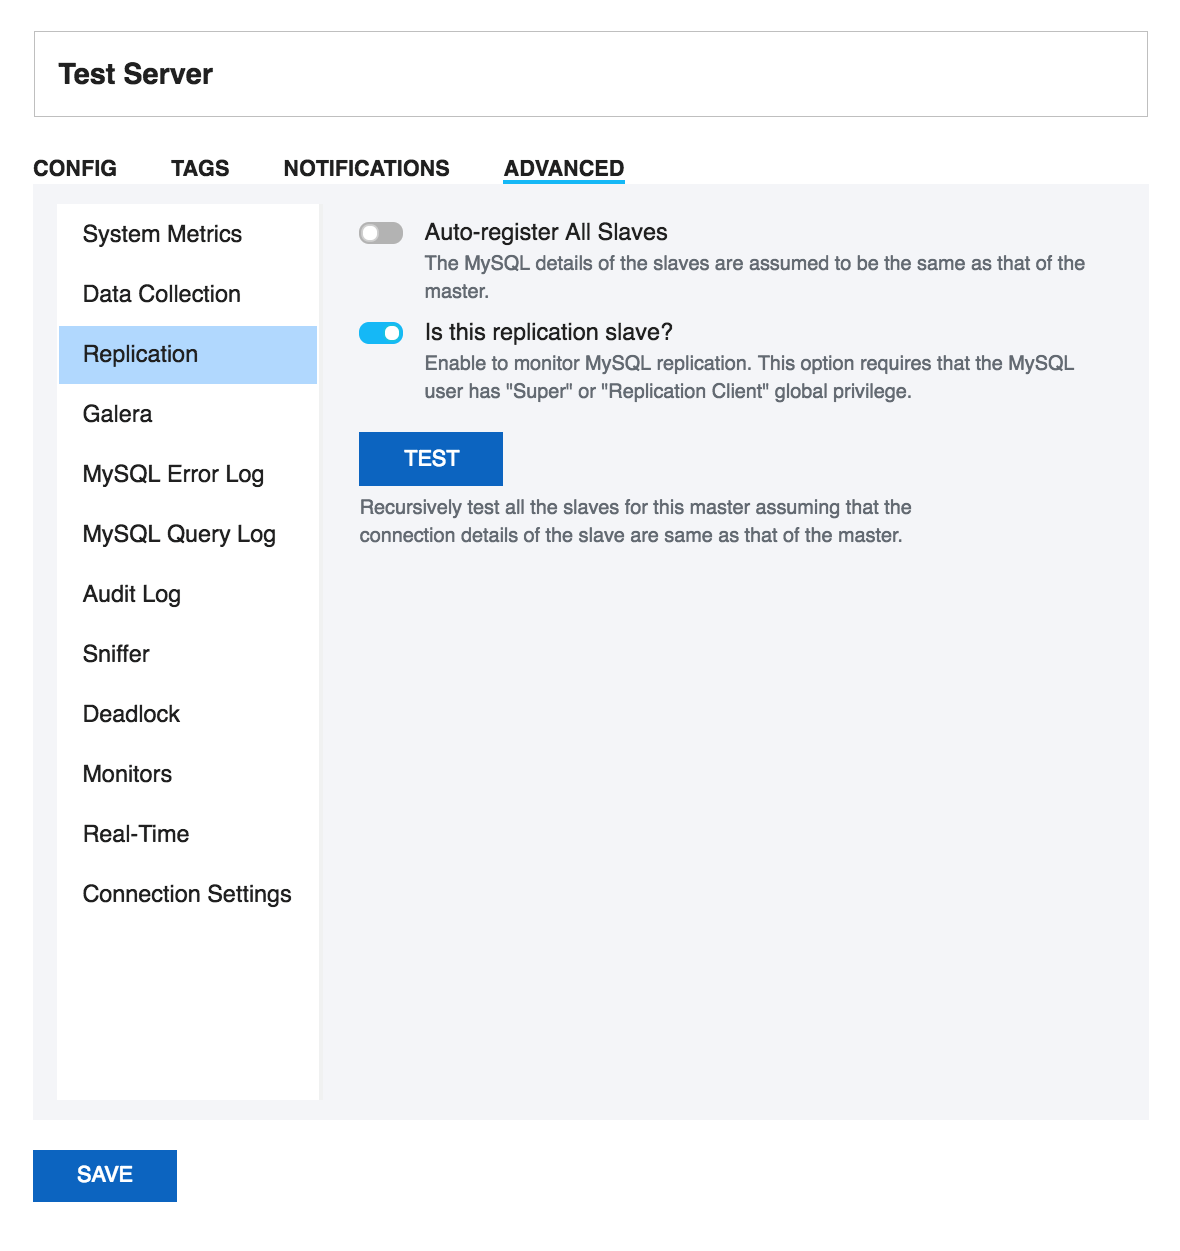
Replication Slave
Select the toggle switch for Is this a replication slave? To monitor MySQL replication. This option requires that the MySQL user has "Super" or "Replication Client" global privilege.
Automatic registering of slaves
This feature of SQL DM for MySQL saves you time from registering each slave individually. In order for SQL DM for MySQL to auto-register all slaves, select the toggle switch to enable Auto-Register slaves in the Advanced settings tab while registering a slave. If a master is already registered, click Edit Server, and check the Auto-Register slaves in the Advanced settings tab. The MySQL and the SSH details of the slaves are assumed to be the same as that of the master. In case the slave details are different from that of the master, you have to manually edit that server and change details.
The auto-registering of slaves is extended to multiple levels of replication. For instance, lets say Server A is a Master that has Server B as the slave. And Server B has Server C as its slave. In such case, while registering Server A, if you check Auto-Register Slaves, then it registers A, B, and C provided the MySQL and the SSH details of the A is same as that of B.
How does SQL DM for MySQL auto-register all slaves of a given master? SQL DM for MySQL shoots a SHOW FULL PROCESSLIST on the master, and checks for all the slaves connected. (It assumes that MySQL and the SSH details of the slaves are the same as that of the master.) To view replication topology click the Replication tab.
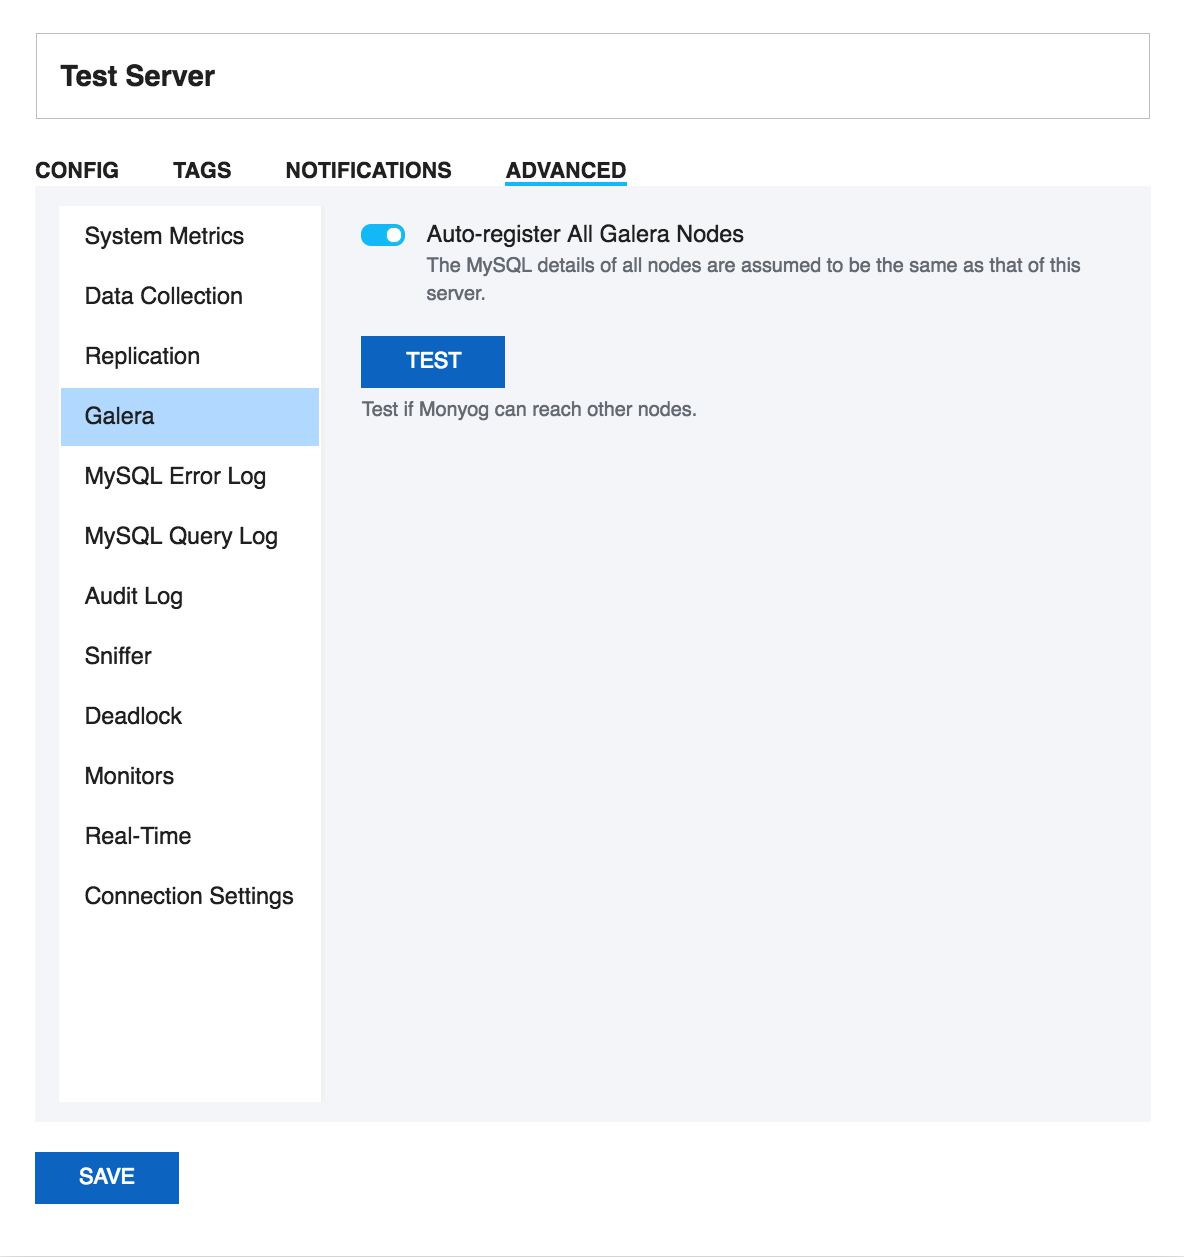
Galera
Use this option to Auto register all the Galera nodes of your cluster with SQL DM for MySQL. The MySQL and the SSH details of the nodes are assumed to be the same as that of the node on which you are enabling this option. In case the other node details are different from that of the node on which you are enabling this option, you need to manually edit that server, and change details. You can do a Test to check if SQL DM for MySQL is able to connect to the other nodes. If the Test gives a successful message then you can go ahead and click Save. SQL DM for MySQL registers the detected nodes and redirects you to the Servers page where you can see all the registered nodes.
MySQL error log settings
The MySQL error log is quintessential in determining the health of the server. You can Enable error log monitoring to allow SQL DM for MySQL to keep an eye on your MySQL Error Log, and notify you of important information.
Enable error log monitoring:
Select the toggle switch to Enable error log monitoring.
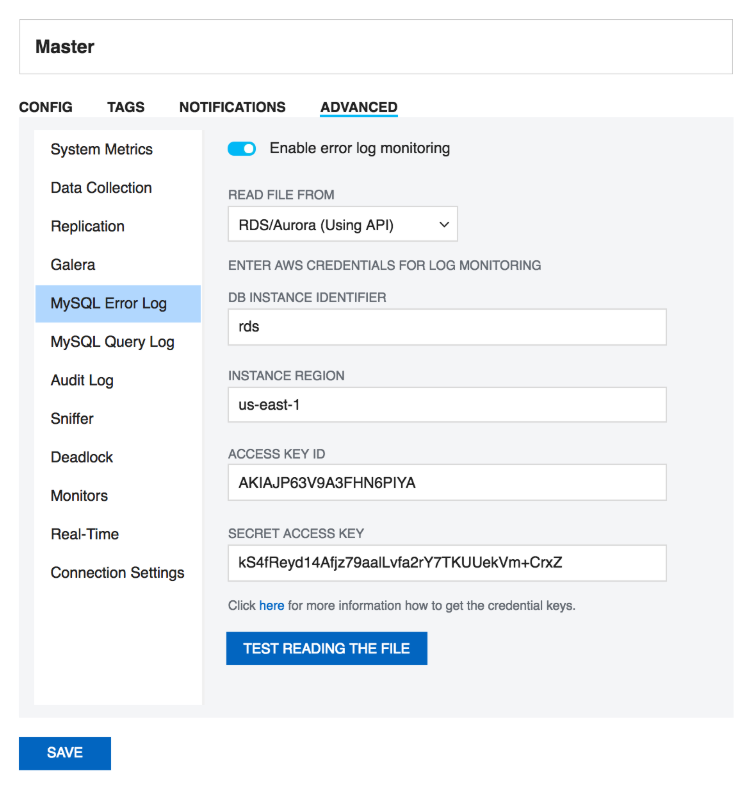
Read file from:
There are 3 ways of accessing the log files: Select "Local path" if the logs are in the machine where SQL DM for MySQL is running, or if they can be accessed by SQL DM for MySQL on a shared network drive. Choose "Via SFTP" if you have configured SQL DM for MySQL to use SSH. Select "RDS/Aurora (Using API)" if your server is a RDS/Aurora instance. In case of RDS/Aurora (Using API) for file based logging, four additional fields have to be filled, which are:
- DB instance identifier: A unique name to identify your RDS/Aurora instance.
- Instance region: The region in which your instance is hosted, for e.g: us-east-1
- Access key ID: It is a 20 character long key ID which can be created from the AWS Management console. It is used to make programmatic request to AWS.
- Secret access key: It is 40 character long and can be created from the AWS Management console. You can refer to the documentation, on how to generate credential keys here: Getting Your Access Key ID and Secret Access Key.
Fetch error log details:
SQL DM for MySQL can automatically get the path of the error log from the MySQL server. Just click the fetch button, and SQL DM for MySQL will do the rest for you.
File path:
If you choose to enter the error log file path manually, you may do so here.
Test path:
Click this button to check if SQL DM for MySQL can access the file specified in the File path.
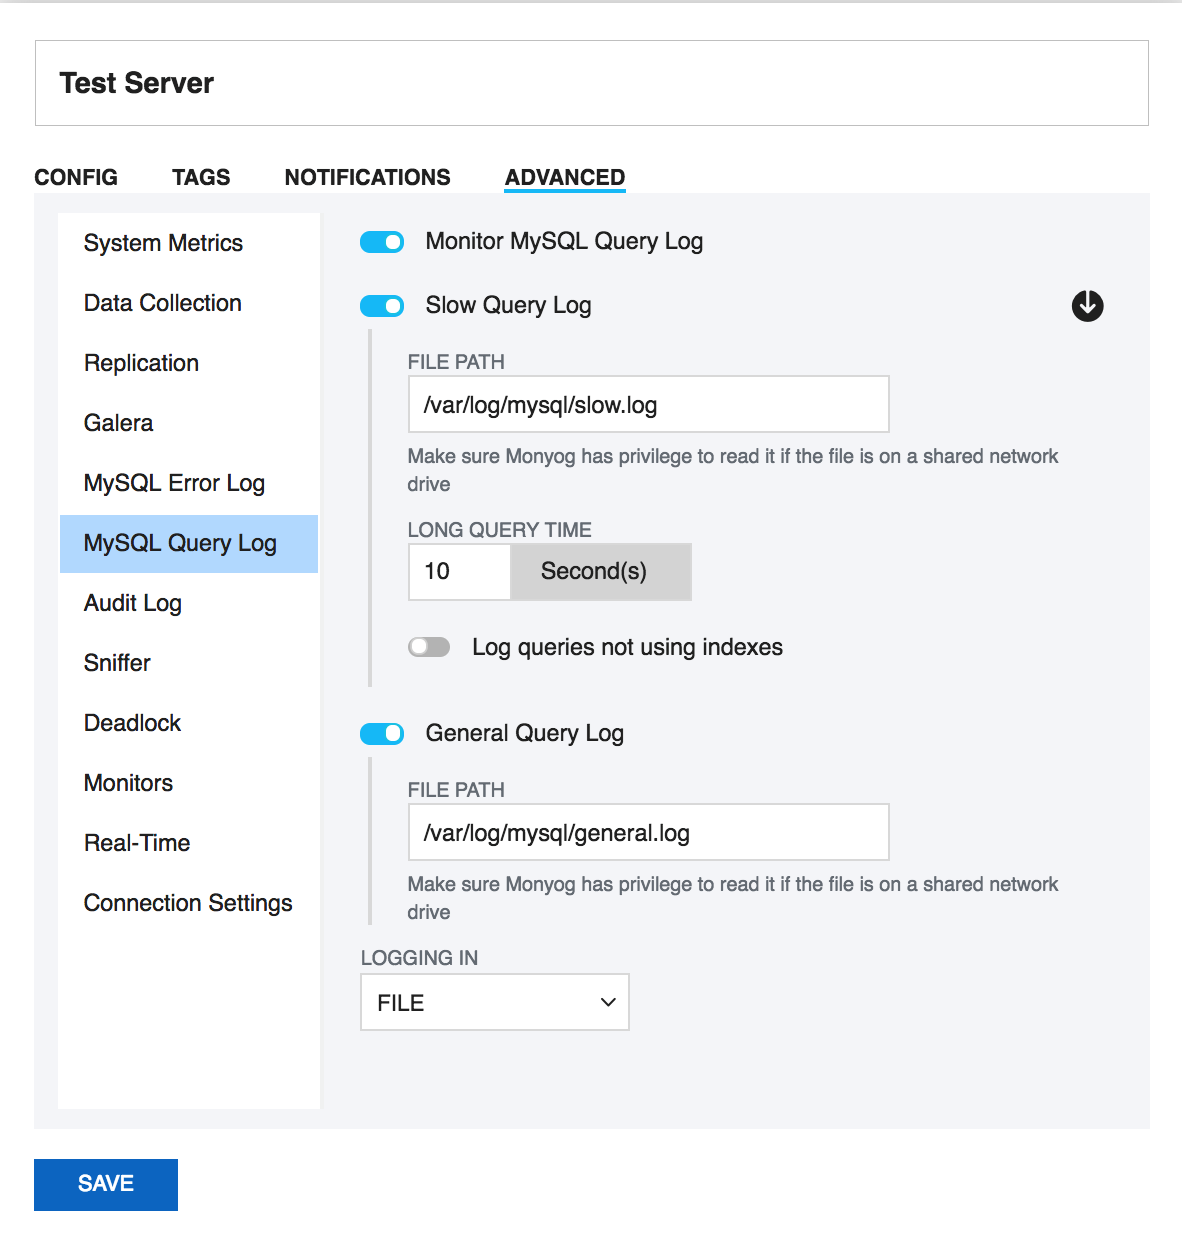
MySQL query log settings
SQL DM for MySQL retrieves (completely or partially) the General query log and the Slow query log from the MySQL servers it connects to, and analyzes them. Here, we see how to set up details for the connection, so that log analysis is available with SQL DM for MySQL. You have to set up details for the general query log and the slow query log independently. Enabling Slow Query Log 'log queries not using indexes' instead needs SUPER privilege. Refer to the MySQL documentation on how to enable and configure logging. MySQL server logs can be written to files on the server machine or to tables in the MySQL database itself.
The MySQL server (since version 5.0) has an option to log (in the slow log) queries that do not use an index. Such queries need not be slow if there are only a few hundred or few thousand records in the table(s) involved. But they are 'potentially slow' and should be identified if they access tables,which will continue to grow. You can enable and disable this from here too (SQL DM for MySQL will send the appropriate SET of statements to MySQL) Note: Only DML and DDL queries are recorded in the slow query log.
Logs written to files:
First, lets consider the situation where server logs are stored as files on the server machine. This is the most common situation and the only one available with MySQL servers before version 5.1. First time you configure a server with this option, click the Fetch query log details button. The MySQL server knows (it is stored in server variables) what logs are enabled and how logging is configured. Click Test Path to verify that the path SQL DM for MySQL connects and verifies the existence of the file (but not its content).
The log files can be accessed from the local file system (if SQL DM for MySQL and MySQL is running on the same computer) or by using SFTP (if SQL DM for MySQL and MySQL is running on different computers) or by using RDS/Aurora (Using API) if you are using a RDS/Aurora instance. Note that you must use the file and path syntax of the machine where the logs are.
If the log files can be accessed from a shared drive, over a network, or from a network enabled file system (like NFS on Linux), then SQL DM for MySQL can access them as if they were local files. No additional SSH/SFTP configuration is required in this case: the operating system takes care of the file transfer transparently.
When via SFTP option is chosen, then SSH server details as defined in SSH server details settings are used to read the file from the remote system. Note that the SSH user must have read access to the log files.
When RDS/Aurora (Using API) option is chosen, make sure that you have the required Access credentials with you to fetch the log files. The Access credentials can be generated from the AWS Management Console. You can refer to the documentation, on how to generate credential keys here: Getting Your Access Key ID and Secret Access Key.
By default, MONyog(SQL DM for MySQL) service runs under Local System Account. If you have Slow query or General query logs in a Mapped Network Drive, SQL DM for MySQL is not be able to reach it. You need to use UNC notation for SQL DM for MySQL to be able to access them. See FAQ 31 for details.
Logs written to MySQL tables:
This option is supported by MySQL from version 5.1. Also, SQL DM for MySQL supports when this option is available. Here, you click the Fetch Log Details From MySQL button. When this option is used there is no file path to configure and no SSH details to consider. SQL DM for MySQL can retrieve the server log by sending simple SELECT statements. Only the MySQL user used by SQL DM for MySQL to connect to MySQL must have SELECT privileges to the tables.
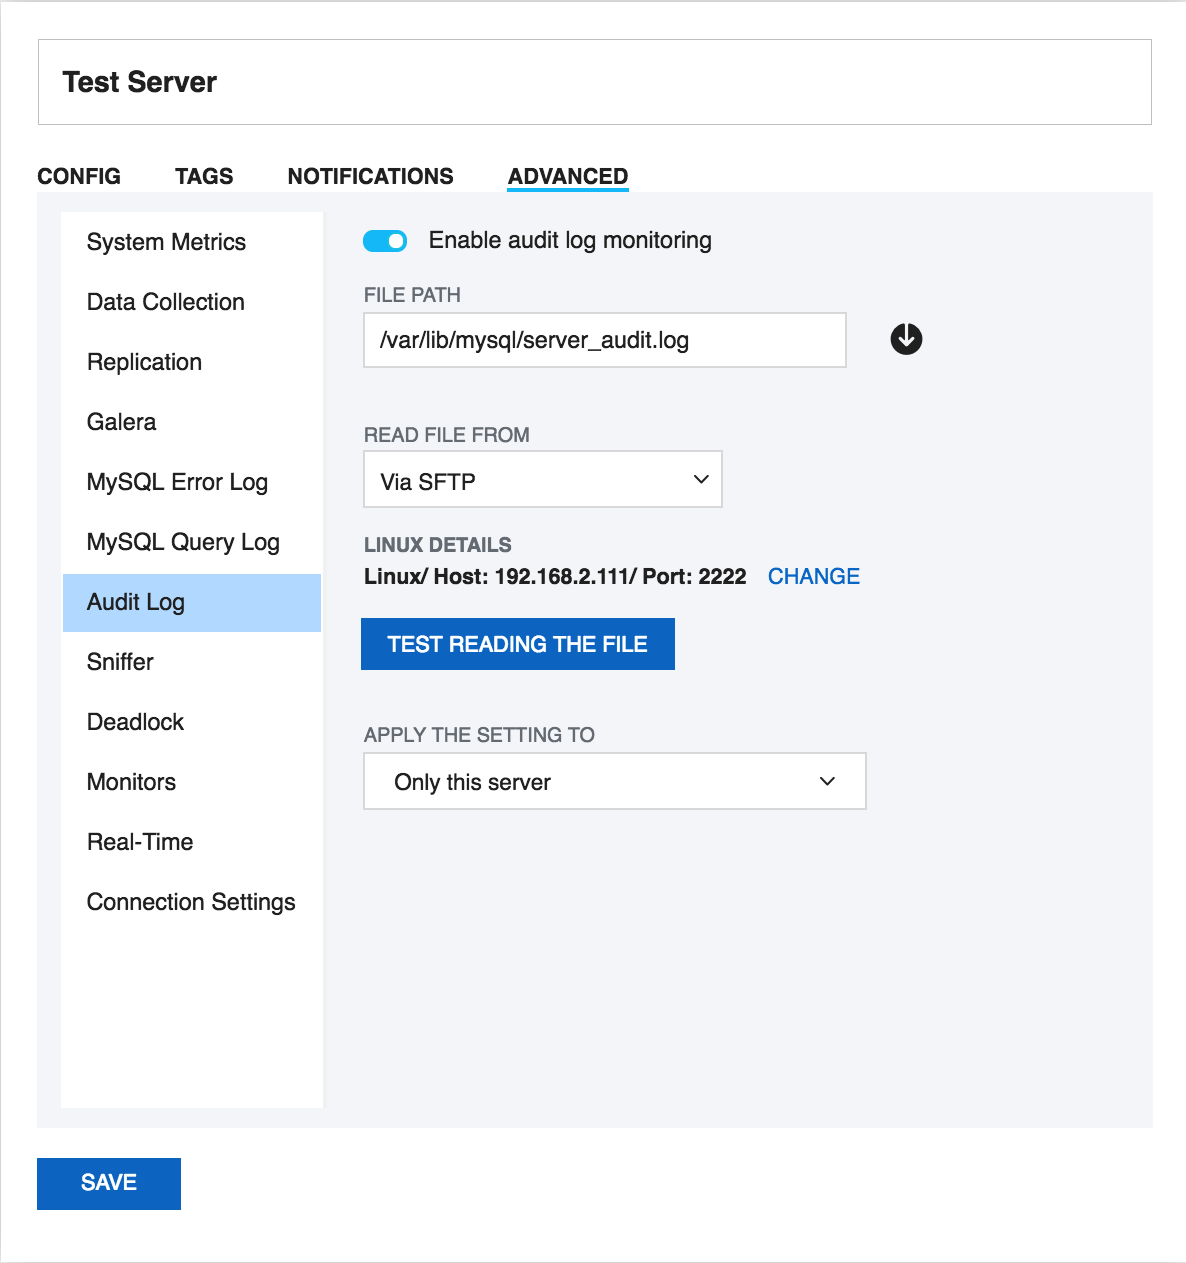
Audit Log Settings
This works exactly the same way as the MySQL Error log and MySQL Query Log. On enabling audit log monitoring, SQL DM for MySQL fetches the path from the server and displays it in the File Path box. Note that, we get the path from the variable "server_audit_file_path", and by default it just returns the audit log file name. In such cases, you have to manually enter the path for the audit log (by default, the path is same as datadir path).
Next, depending on where you have the MySQL server running, select an appropriate option for Read File From. If the server is on the same machine as SQL DM for MySQL, choose Local path. If it is on a remote machine, choose Via SFTP and give the corresponding SSH details. If the server is a RDS/Aurora server, then choose RDS/Aurora (Using API).
Sniffer Settings
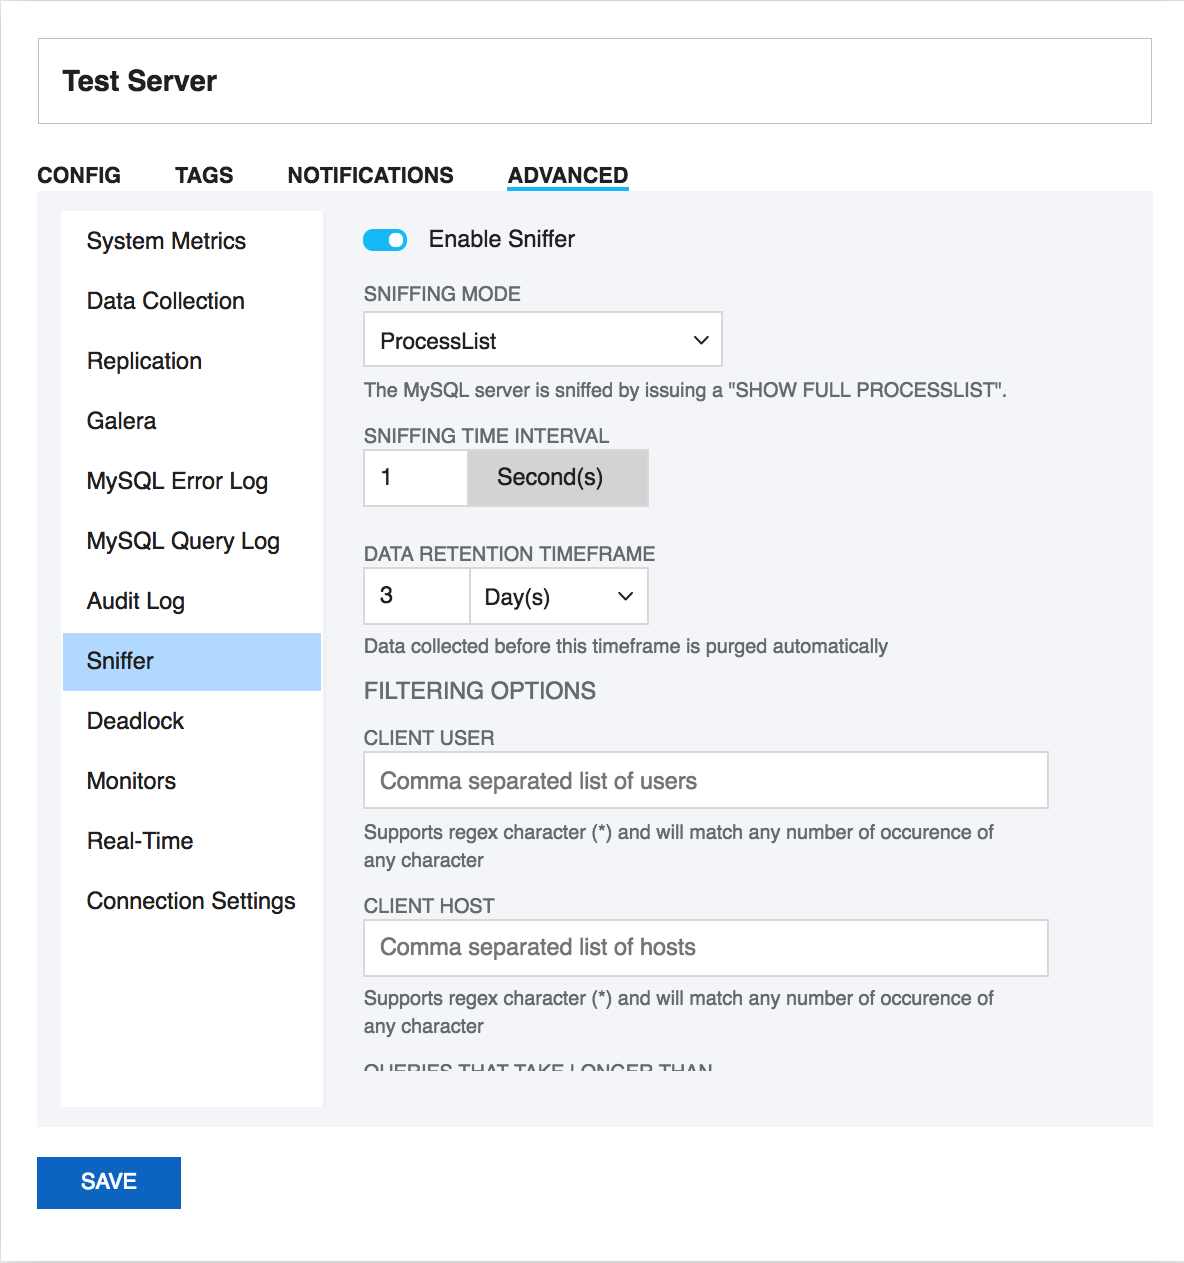
SQL DM for MySQL query sniffer is a functionality that records a pseudo server log and stores it in the SQL DM for MySQL embedded database. With Sniffer enabled, SQL DM for MySQL can populate the pseudo server log in three different ways at the intervals you specify:
- By utilizing Performance Schema tables (events_statements_summary_by_digest, events_statements_history_long) and collecting snapshots at regular intervals.
- By sending the query SHOW FULL PROCESSLIST to the MySQL server.
- Or by connecting to a running instance of the MySQL-Proxy program that is used by one or more clients to connect to a MySQL server.
For MySQL 5.6.14 and above you can use Performance schema(if Performance Schema is enabled), Proxy and Processlist for query analysis. If using MySQL version less than 5.6.14 then you can use Processlist mode.
Performance Schema on MySQL contains queries executed on server along with other information
- Number of rows sent and examined
- Number of temporary tables created on disk
- Number of temporary tables created on memory
- Number of joins performed and the type of join
- Whether sorting happened and the type of sort
- Whether index used
- Whether good index used
SQL DM for MySQL uses performance schema statement digest table(events_statements_summary_by_digest) to get the above information and is dependent on the statements_digest in setup_consumers table. By default, this is enabled. If not, it can be enabled by executing the following:
UPDATE performance_schema.setup_consumers
SET enabled = 'YES'
WHERE name = 'statements_digest';
Example query is available in events_statements_history_long table and has to be enabled and is dependent on the events_statements_history_long in setup_consumers table. By default, this is not enabled and should be enabled by executing the following:
UPDATE performance_schema.setup_consumers
SET enabled = 'YES'
WHERE name = 'events_statements_history_long';
The performance_schema.events_statements_summary_by_digest table size is dependent on performance_schema_digests_size global variable. By default, this size is set to 5000 rows. Once it reaches this limit you may lose the queries. SQL DM for MySQL provides an option to truncate the performance schema digest table when it reaches 80% of performance_schema_digests_size.
Although configuring a Proxy instance is a little more complicated, the PROXY-based sniffer has several advantages over the PROCESSLIST-based, including:
- All queries that was handled by the Proxy will be recorded by SQL DM for MySQL sniffer when PROXY option is used. When PROCESSLIST option is used very fast queries may execute completely between two SHOW FULL PROCESSLIST queries and will then not be recorded.
- You can choose to analyze queries from specific client(s)/application(s) only. Simply let (only) the clients that you want to focus on at the moment connect through the Proxy.
- When using the PROXY option you can distribute part of the load generated by the sniffer on the machine that fits best in your deployment scenario (like on the one that has most free resources available) by deciding where to have the PROXY: The MySQL machine, the SQL DM for MySQL machine (if not the same) or quite another machine. The machine running MySQL will have no additional load due to the sniffer if the Proxy is not running on that machine.
Also note that, if more SQL DM for MySQL instances use the same PROXY they use the same data collected, when the Proxy Sniffing is enabled by the first SQL DM for MySQL instance. To work with SQL DM for MySQL sniffer the MySQL Proxy instance must be started with the name of a LUA script called MONyog.LUA (LUA is a scripting/programming language) as argument and is distributed with SQL DM for MySQL. You can find it in the MONyog program folder after installing (Windows and Linux RPM) or unpacking (Linux .tar.gz) the SQL DM for MySQL program package as downloaded from the IDERA website. The MySQL Proxy program however you need to download from MySQL website (we cannot include it for license reasons). SQL DM for MySQL works with Proxy versions from 0.61 to 0.81(latest currently) with the exception of 0.7x versions for windows and Mac due to a bug in those specific builds. For more information on Proxy, see MySQL Proxy.
To start a Proxy instance for use with SQL DM for MySQL use the command:
- For v0.81(Alpha) and later, run the following common from the Proxy installation folder:
# mysql-proxy --proxy-backend-addresses=192.168.x.x:3305 \
          --proxy-address=192.168.y.y:4045 \
          --admin-username=root \
          --admin-password=root \
          --admin-lua-script=MONyog.lua \
          --proxy-lua-script=MONyog.lua
- For Older versions, from the Proxy installation folder, run:
# mysql-proxy --proxy-backend-addresses=192.168.x.x:3305 \
          --proxy-address=192.168.y.y:4045 \
          --proxy-lua-script=MONyog.lua
(It is assumed that the 'MONyog.LUA' was copied to the folder where the PROXY binary is). Also note that, if no port is specified the PROXY listens on port 4040. Now, you can connect to the Proxy from one or more clients/applications. The Proxy sends queries to MySQL and the results back to the client. But when started with the LUA script for SQL DM for MySQL sniffer it also sends information to SQL DM for MySQL that SQL DM for MySQL uses to populate the sniffer 'pseudo log'.
Once this 'seudo log has been recorded (in either of the three ways described: Performance Schema, PROCESSLIST or PROXY-based) the SQL DM for MySQL log analysis functionalities can operate on the pseudo log as well as the real logs. The data recorded in the pseudo log is purged automatically based on the data retention timeframe option set by you.
Further some filtering options are provided. This filtering happens before storing to the SQL DM for MySQL database. This prevents the sniffer database to grow out of control. The filtering options are as follow:
- User and host: You can choose to store queries executed only by a specific combination of users and/or hosts.
- Minimum time taken: For every
PROCESSLISTreturned to SQL DM for MySQL, the queries are recorded in the embedded database only if they have been executing for a time greater than the specified minimum execution time. Furthermore, if a query with the same structure and details (like process ID) as one already recorded is encountered, the embedded database is UPDATED, and the statement is recorded only once.
This setting should be somewhat larger than the sample interval (and also consider the latency of the connection). If set lower it would not really make much sense.
- Queries starting with: Enter any string and only queries starting with that string are recorded. Examples:
SELECT *,UPDATE Customer_Base.
Also note that in PROCESSLIST Sniffer we have an option Long Running Query Options where you can monitor the long running queries by notifying or killing a query which takes more than a time specified by you. You can also specify users whose queries will be ignored (i.e. queries by such user are never killed by SQL DM for MySQL) and never raise an alert even if they take a longer than the time specified under 'LONG RUNNING QUERY TIME' you specified.
Clicking Monitor only locked queries would only monitor those long queries that are locked.
You should note that the query sniffer is not a complete 'general log'. Very fast statements may or may not be recorded as they may or may not finish executing between two PROCESSLISTs generated. The time interval between subsequent data collections for the 'pseudo log' depends on the connection to the MySQL server.
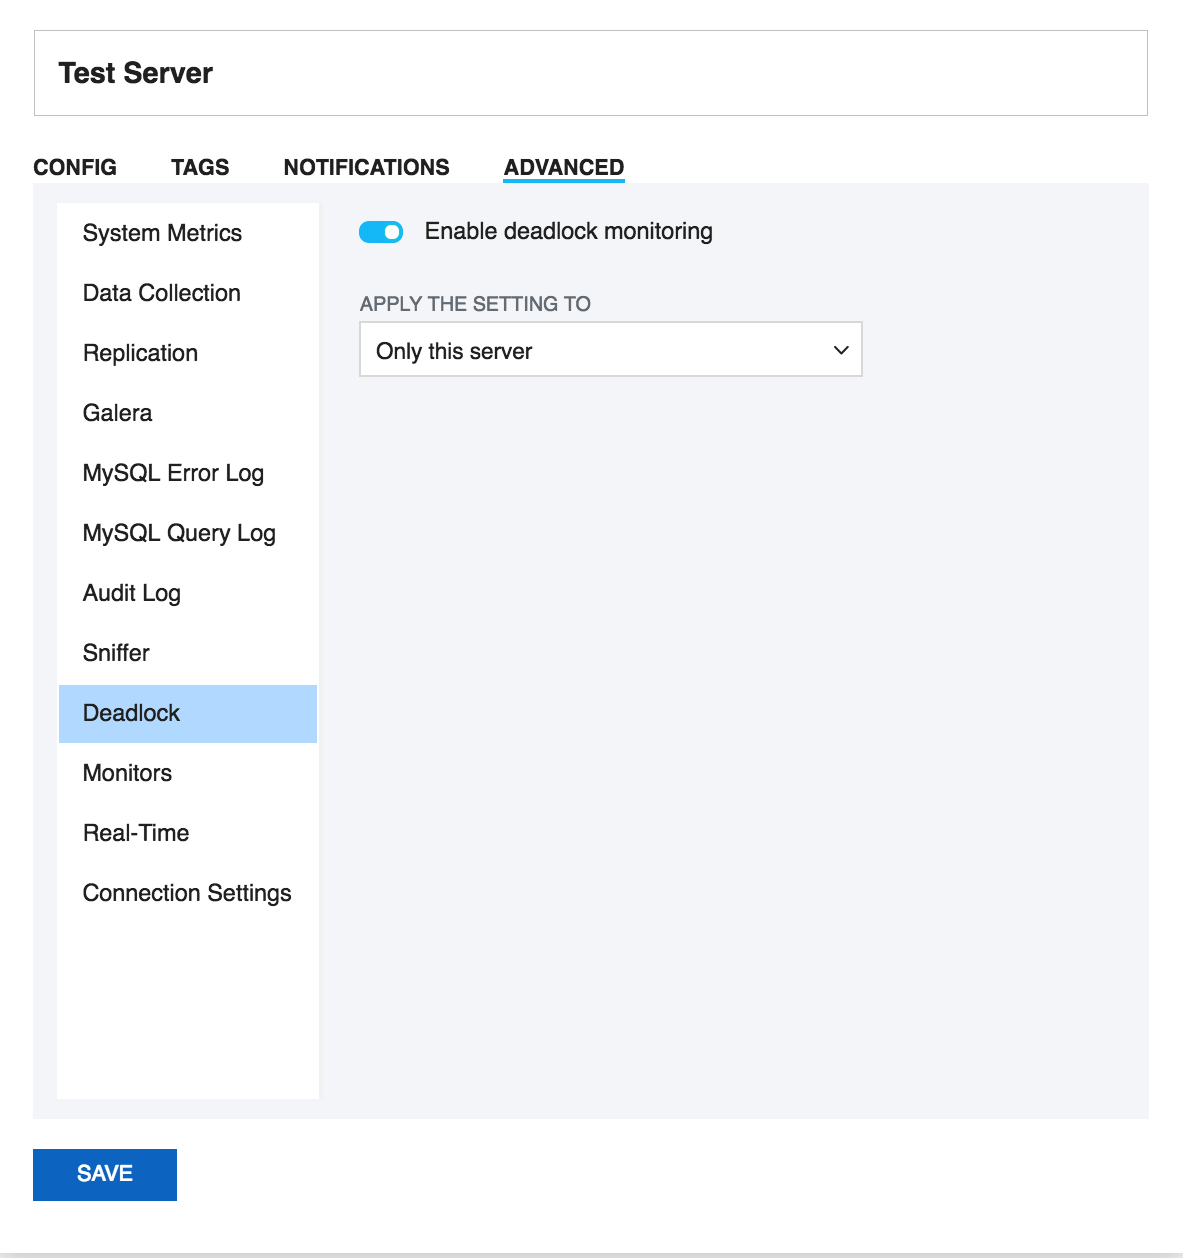
Deadlock settings
In transactional databases deadlocks are a classic problem, but these deadlocks are not too dangerous unless they are so frequent that you cannot run certain transactions at all. To trace the deadlocks reported by INNODB STATUS, you can select the toggle switch to "Enable deadlock monitoring" option.
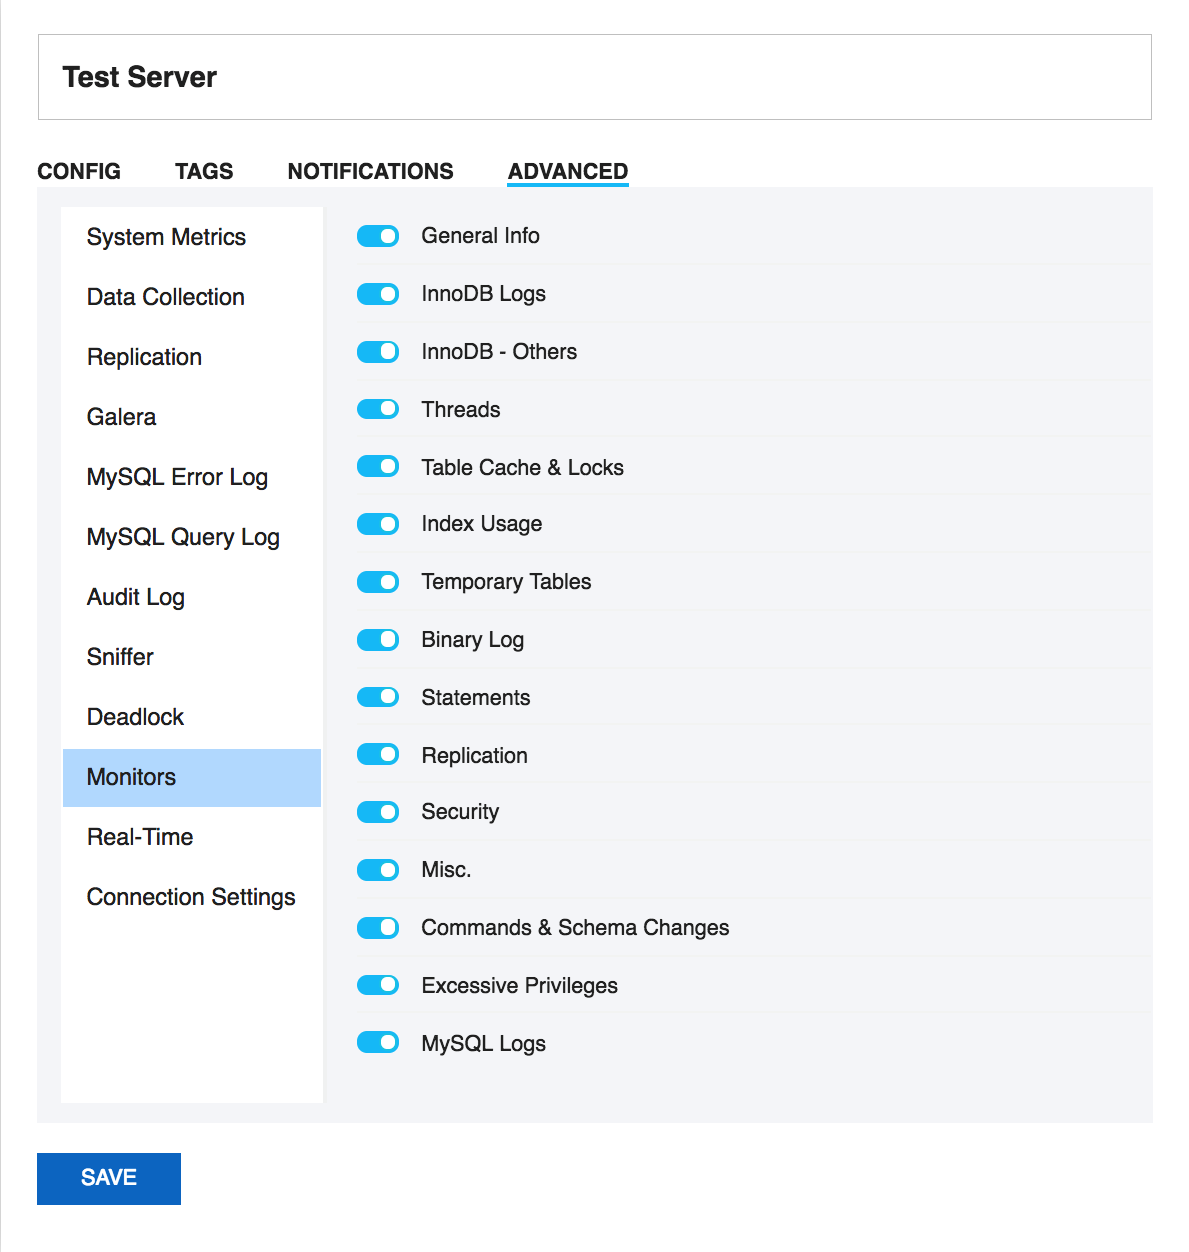
Monitors Settings
SQL DM for MySQL provides a way of disabling an entire group of Monitors. For instance if a MySQL server is not a replication slave, then the replication group can be disabled.
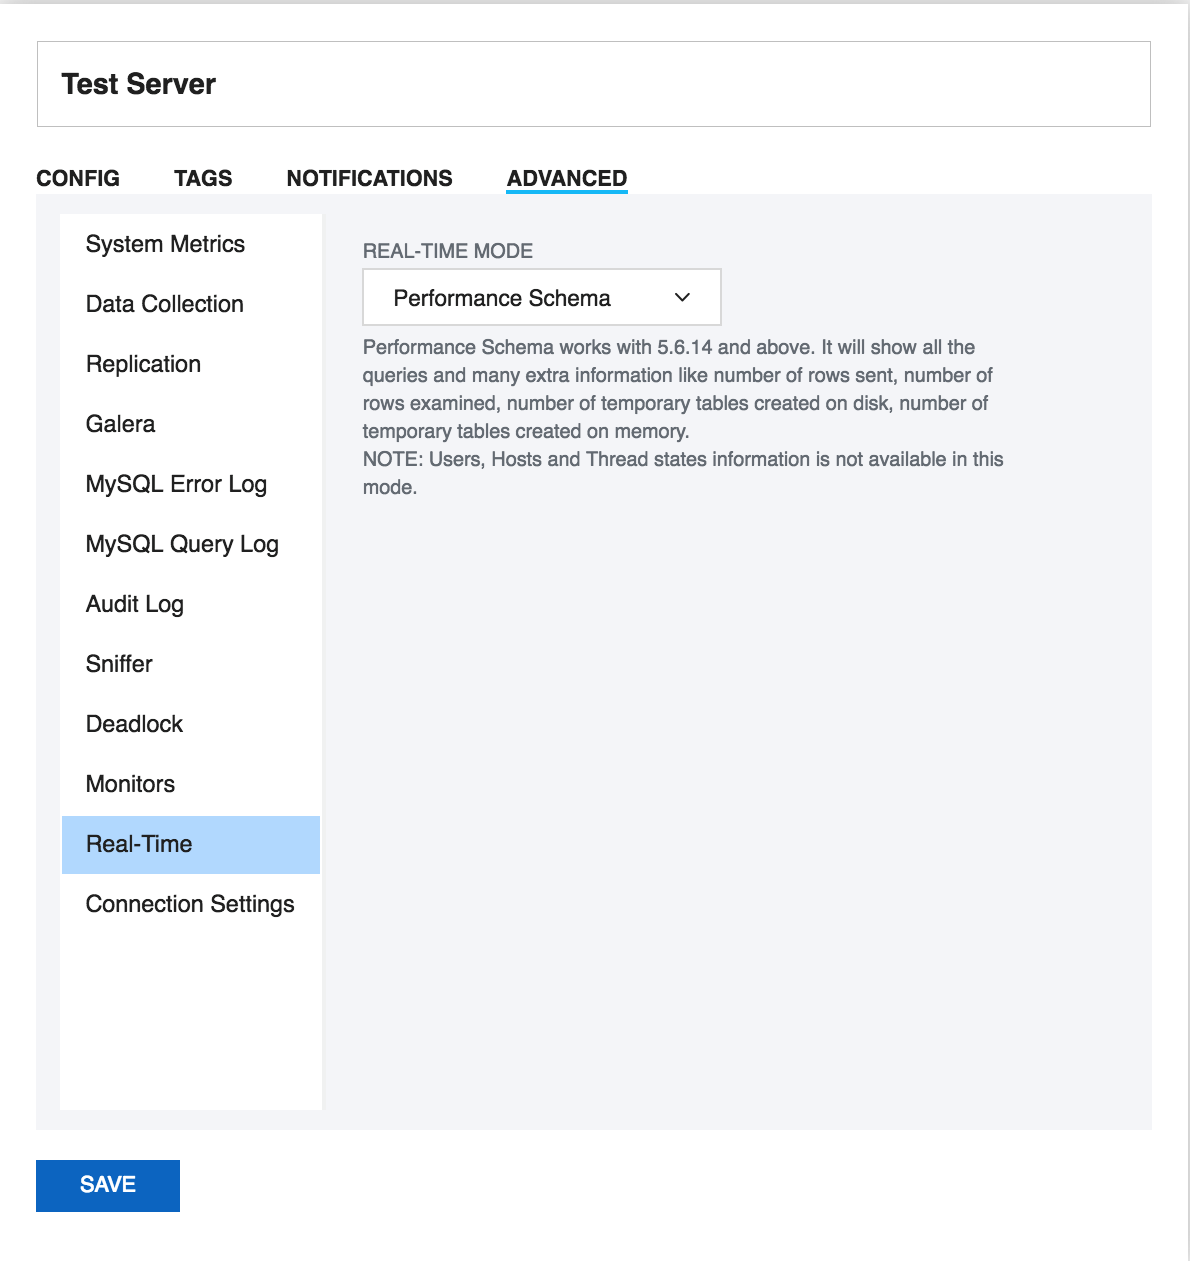
Real-time
SQL DM for MySQL provides you the option to choose the data collection mode for Real-time monitoring. Here, you can choose between Processlist and Performance schema. You can choose the Performance schema mode if your MySQL version is 5.6.14 or above and if performance schema is enabled, otherwise you can go with Processlist mode.
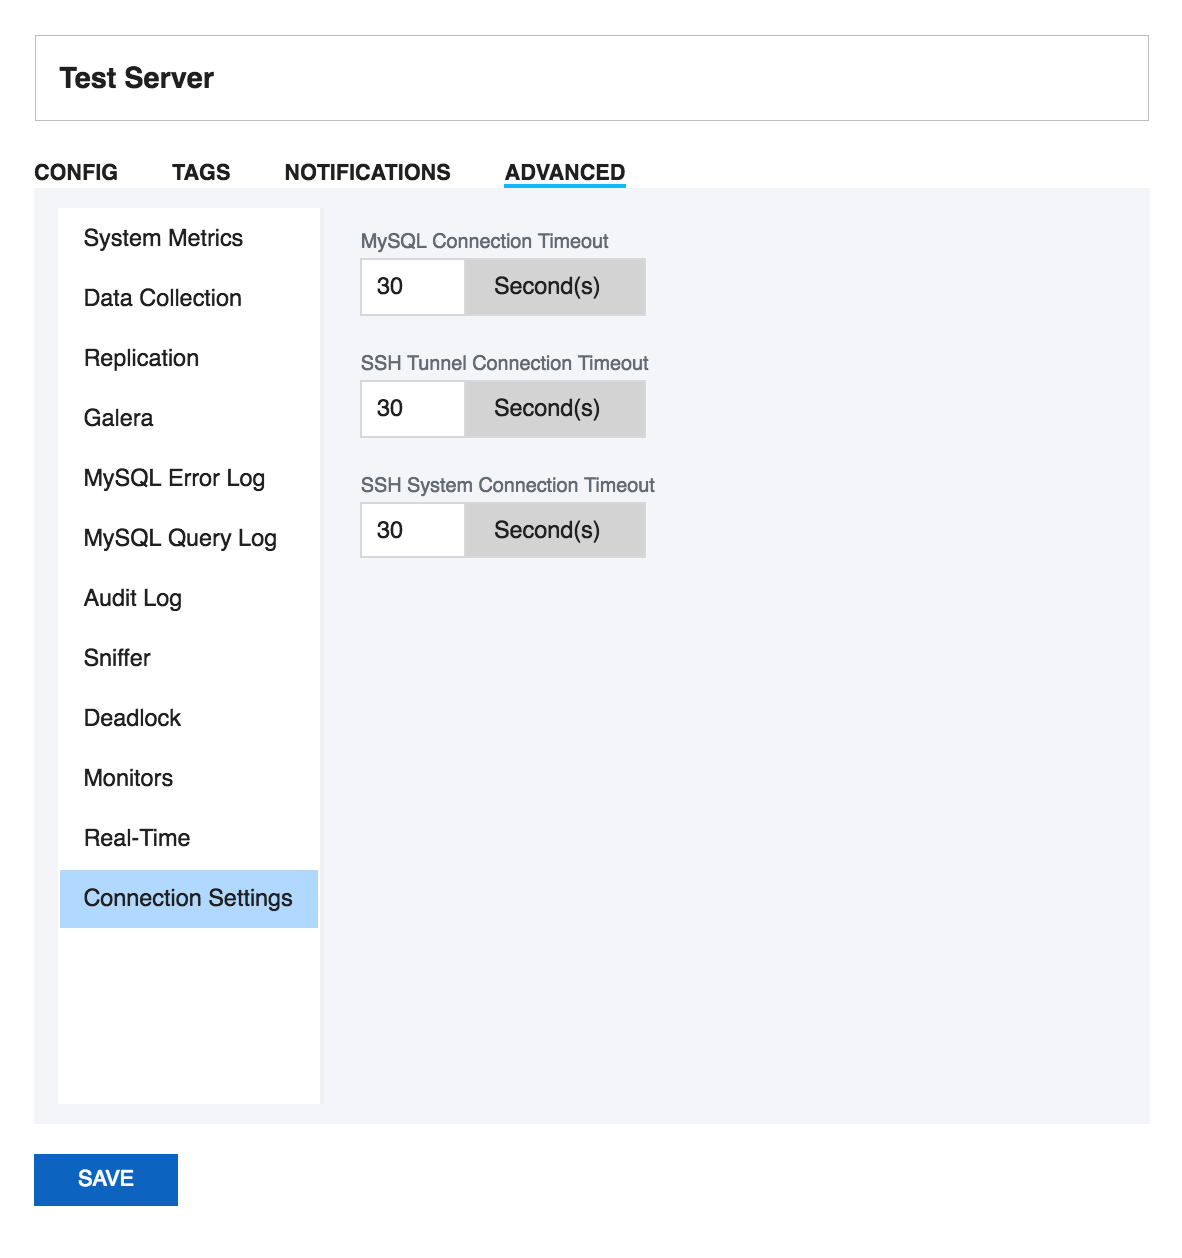
Connection Settings
You can specify the MySQL Connection Timeout value for your server. This option simply means that SQL DM for MySQL waits for this long to get a response from the server before it throws an error. This comes handy to avoid false positives when connection to some specific servers is slow. You can setup a larger timeout in such cases. If you have SSH Tunneling enabled to the MySQL then you can specify a SSH Tunnel Connection Timeout, and a SSH System Connection Timeout if System Metrics is enabled. The default value for all being 30 seconds.