Page History
The single instance dashboard provides you with the Sessions tab which allows you to quickly view key diagnostic statistics for sessions on your SQL Server instance and contains the following viewstabs:
Anchor Listing Listing
Listing
| Listing | |
| Listing |
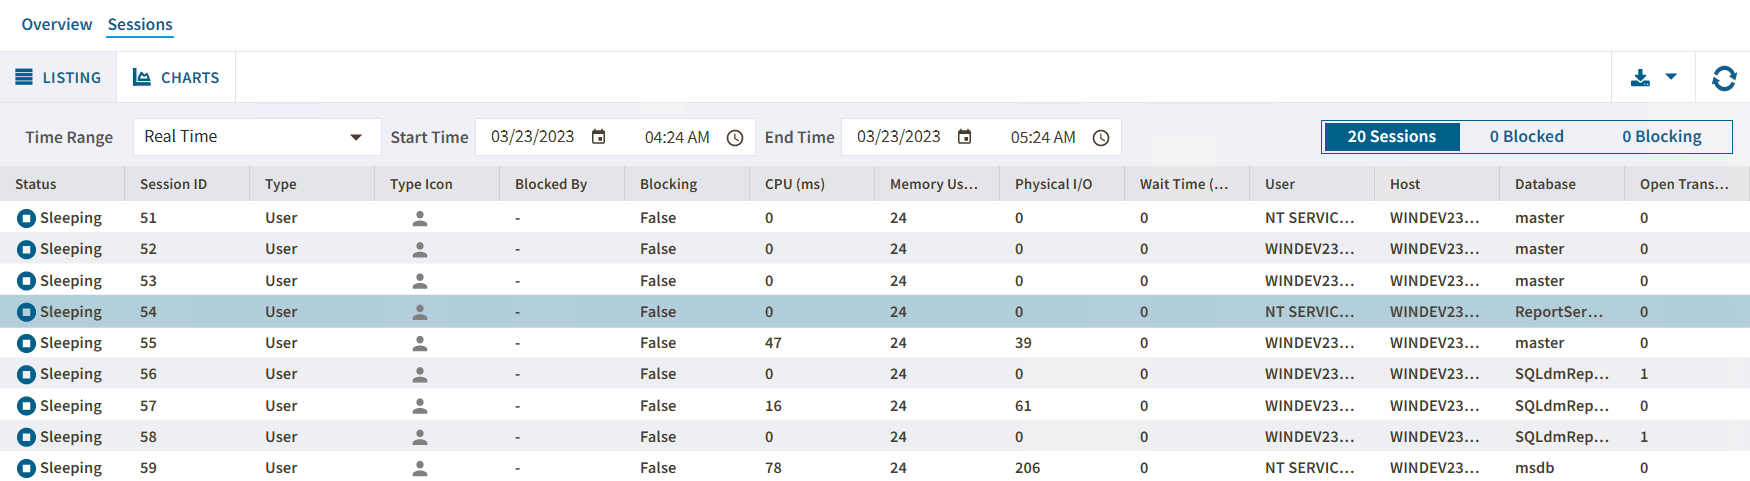
The Listing view tab helps you to monitor your SQL Server instances. To do so, you can choose one or more of the diagnostic statistics metrics:
...
The Session tab allows you to get a detailed summary for of each session. To check the sessions session details, double-click in on a specific session and the following window will pop up.
...
In the Session Details window, you will find sessions data regarding to:
- Connection information
- Usage metrics
- Last Command used
- Lock Information metrics
- Temp DB Usage metrics
- Space used in kb (alloc/deadloc) metrics
Anchor Chart Chart
Charts
| Chart | |
| Chart |
The Sessions > Sessions Graphs tab contains Charts tab gives you a graphic status session report containing the following charts (Click image to view full size) :
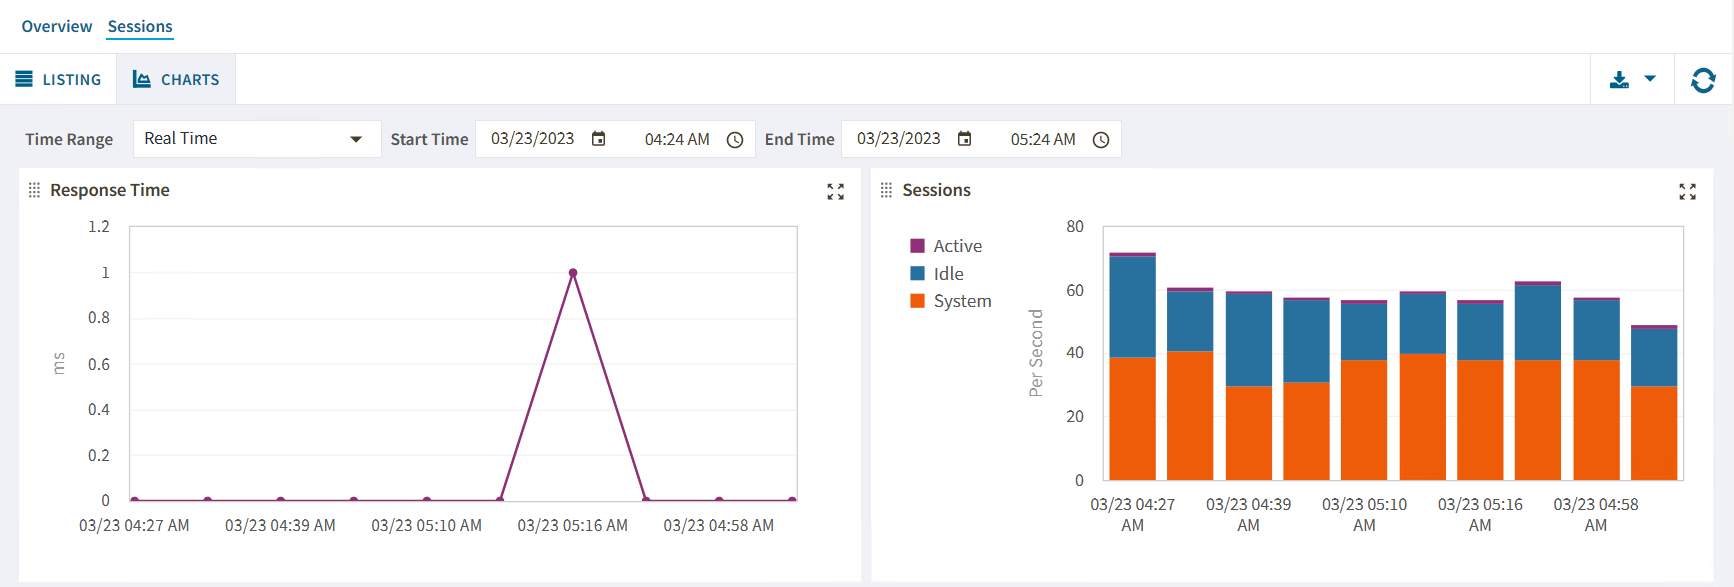
Response Time (ms)
The Response Time chart displays the response time (in milliseconds) it takes a Select SQL statement to go to the SQL Server instance and back. This chart indicates the current speed and congestion of the network as well as the speed with which SQL Server processes small queries.
...
Sessions
The Session Activity chart displays the number of concurrent connections to the monitored SQL Server instance over time. The total number of sessions includes the active, idle, and system sessions.
Blocked Sessions
The Blocked Sessions
...
chart lists
...
all the Blocked Sessions, Lead Blockers, and
...
Total Deadlocks for the selected
...
SQL Server instance. This allows you to easily view blocks as they occur.
...
Access the Sessions tab
...
Lock Statistics
The Lock Statistics chart displays all the lock object statistics, helping you to pinpoint, correct, or reschedule automated applications that cause extensive row, table, or database locking. The chart includes the following objects.
- AllocUnit - Represents a lock on an allocation unit.
- Application - Represents a lock on an application-specific resource.
Database - Represents a lock on a database, including all objects in the database.
Extent - Represents a lock on a contiguous group of eight pages.
File - Represents a lock on a database file.
HoBT - (Heap or BTree) Represents a lock on a heap of data pages, or on the BTree structure of an index.
Key - Represents a lock on a row in an index.
Latch - Represents a lock on a latch.
Metadata - Represents a lock on a piece of catalog information, also called metadata.
Object - Represents a lock on an item such as a table, stored procedure, or view, including all data and indexes. The object represents anything that has an entry in sys.all_objects.
Page - Represents a lock on an 8 KB page in a database.
RID - (Row ID) Represents a lock on a single row in a heap.
Table - Represents a lock on a table.