Access the Alerts view from the SQLDM desktop console by clicking the Alerts tab.
Organize your alerts by Active Alerts
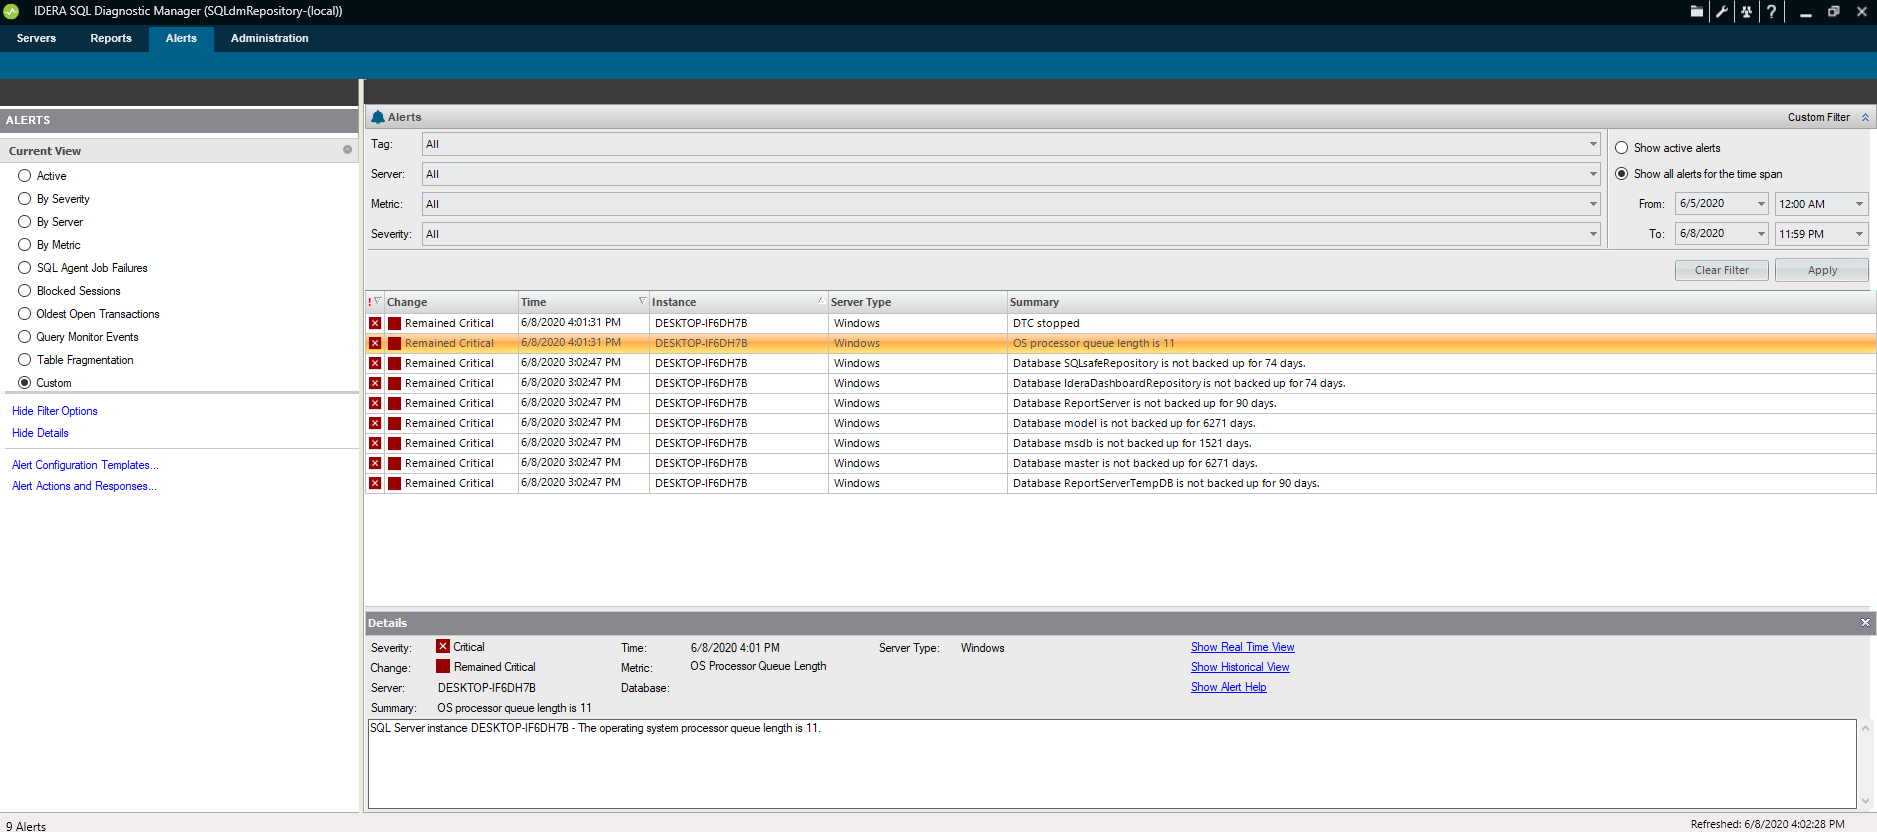
The Alerts tab allows you to view all the alerts for all of the monitored servers. Under the Alerts screen you can review all the active alerts; additionally, you can filter them by selecting an specific time frame.
Tag, Server, Metric, and Severity are the main custom filters you can configure under the Alerts screen, use Apply to retrieve the alerts under the configuration you choose or use Clear Filter to remove all the configured filter options.
The Change column is a useful way to see the agent history of a metric. This column tracks every status change occurring between OK, informational, warning, and critical states.
Organize your alerts by the Current View
You can organize your alerts by selecting one of the following views from the Current View section of the Navigation Pane:
Active
Organizes all your alerts that are currently active.
By Severity
Organizes all your alerts by their severity.
By Server
Organizes all your alerts by monitored SQL Server instance.
By Metric
Organizes all your alerts by each of the metrics affected.
Agent Job Failures
Lists all the alerts caused by Agent Job failures.
Blocked Processes
Lists all the alerts caused by blocked processes.
Oldest Open Transactions
Lists the oldest open transactions that have alerts associated with them.
Query Monitor
Lists all the alerts associated with the Query Monitor.
Table Reorganization
Lists all the alerts associated with table reorganization.
Custom
Allows you to configure the view to show what is most important to you.
Organize your alerts using the Filter Options
SQL Diagnostic Manager allows you to organize your alerts using the available filter options. Click the Show Filter Options/Hide Filter Options toggle in the Navigation Pane to open the Alerts filter. Filter options such as the specific view, SQL Server instance, metric, severity, and time range associated with the alert help pinpoint to data you want to view.